OPEN-SOURCE SCRIPT
Finnie's RSI with EMA crossover + Stoch
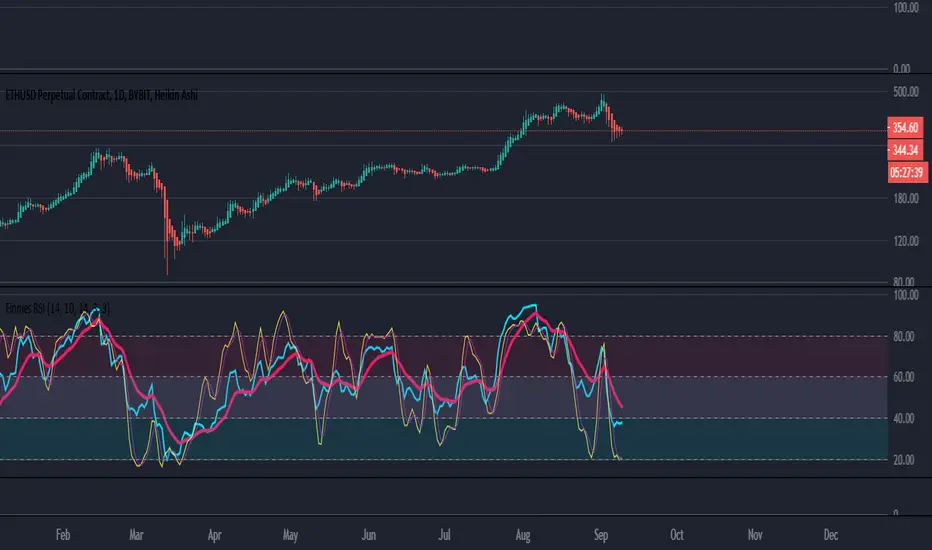
RSI seams to be one of the most used indicators by far, and that comes because of merit. With that in mind, the goal of this indicator is to expand upon the tradition RSI or Relative Strength Index we all know and love :) I started by adding an EMA crossover. Which gives you, the users, a general idea of when to buy and sell outside of just watching a line go down and up. To take thinks even further, I decided to add options for both Fast and Slow Stochastic oscillators. Adding STOCH brings in another variable when deciding on an entry, technically its a bit hard to explain but in practice it would go something like this: you notice RSI is down around the level 20 mark and RSI is crossing up above it's EMA, which is BULLISH signal, and you're thinking about going long. As a second confirmation you can look at the STOCH rsi, if it's also crossing above the previously spoken EMA that's another BULLISH signal. This process can be repeated once RSI has risen to find an exit.
EDIT: If you find the indicator is a bit too cluttered for you, feel free to disable the 'STOCH rsi' feature in settings :)
EDIT: If you find the indicator is a bit too cluttered for you, feel free to disable the 'STOCH rsi' feature in settings :)
Açık kaynak kodlu komut dosyası
Gerçek TradingView ruhuyla, bu komut dosyasının mimarı, yatırımcıların işlevselliğini inceleyip doğrulayabilmesi için onu açık kaynaklı hale getirdi. Yazarı tebrik ederiz! Ücretsiz olarak kullanabilseniz de, kodu yeniden yayınlamanın Topluluk Kurallarımıza tabi olduğunu unutmayın.
Feragatname
Bilgiler ve yayınlar, TradingView tarafından sağlanan veya onaylanan finansal, yatırım, alım satım veya diğer türden tavsiye veya öneriler anlamına gelmez ve teşkil etmez. Kullanım Koşulları bölümünde daha fazlasını okuyun.