PROTECTED SOURCE SCRIPT
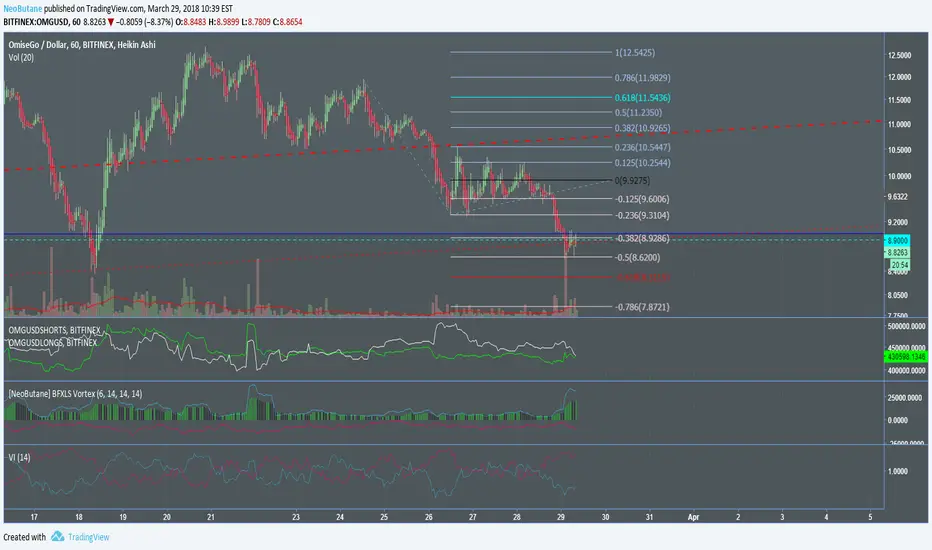
NeoButane Bitfinex BFXLS Vortex Indicator

Scripted longs and shorts to the vortex indicator. It doesn't work like Vortex due to the two plots never crossing to congest.
Blue line: longs
Red line: shorts
Histogram: net volume, ohlc4 of both. Green if previous candle close had lower net volume, black if the previous candle close had more.
Deviance from the histogram: increased volume for the long or short side
Optional ADX line with customizable lookback; it can be difficult to understand due to it being completely horizontal unless you turn off the other plots.
Korumalı komut dosyası
Bu komut dosyası kapalı kaynak olarak yayınlanmaktadır. Ancak, ücretsiz ve herhangi bir sınırlama olmaksızın kullanabilirsiniz – daha fazla bilgiyi buradan edinebilirsiniz.
My published indicators: tradingview.com/u/NeoButane/
Sorry if I haven't replied to your message yet, I'm a bit backlogged :)
Sorry if I haven't replied to your message yet, I'm a bit backlogged :)
Feragatname
Bilgiler ve yayınlar, TradingView tarafından sağlanan veya onaylanan finansal, yatırım, alım satım veya diğer türden tavsiye veya öneriler anlamına gelmez ve teşkil etmez. Kullanım Koşulları bölümünde daha fazlasını okuyun.