OPEN-SOURCE SCRIPT
Decision Threshold
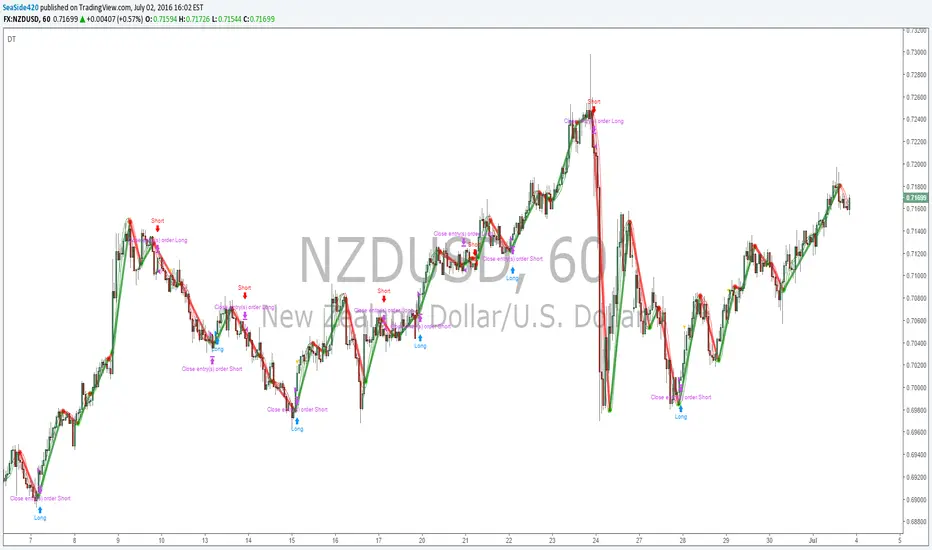
// Hull_MA_cross & Daily_Candle_cross combination with TP$ & SL$ setting
// the theory is that SL$ can be reduced to low amount, to show actual trading results (reducing effect of repaint on results)
// the theory is that SL$ can be reduced to low amount, to show actual trading results (reducing effect of repaint on results)
Açık kaynak kodlu komut dosyası
Gerçek TradingView ruhuna uygun olarak, bu komut dosyasının oluşturucusu bunu açık kaynaklı hale getirmiştir, böylece yatırımcılar betiğin işlevselliğini inceleyip doğrulayabilir. Yazara saygı! Ücretsiz olarak kullanabilirsiniz, ancak kodu yeniden yayınlamanın Site Kurallarımıza tabi olduğunu unutmayın.
Feragatname
Bilgiler ve yayınlar, TradingView tarafından sağlanan veya onaylanan finansal, yatırım, işlem veya diğer türden tavsiye veya tavsiyeler anlamına gelmez ve teşkil etmez. Kullanım Şartları'nda daha fazlasını okuyun.