OPEN-SOURCE SCRIPT
Güncellendi KINSKI Flexible Vortex Indicator
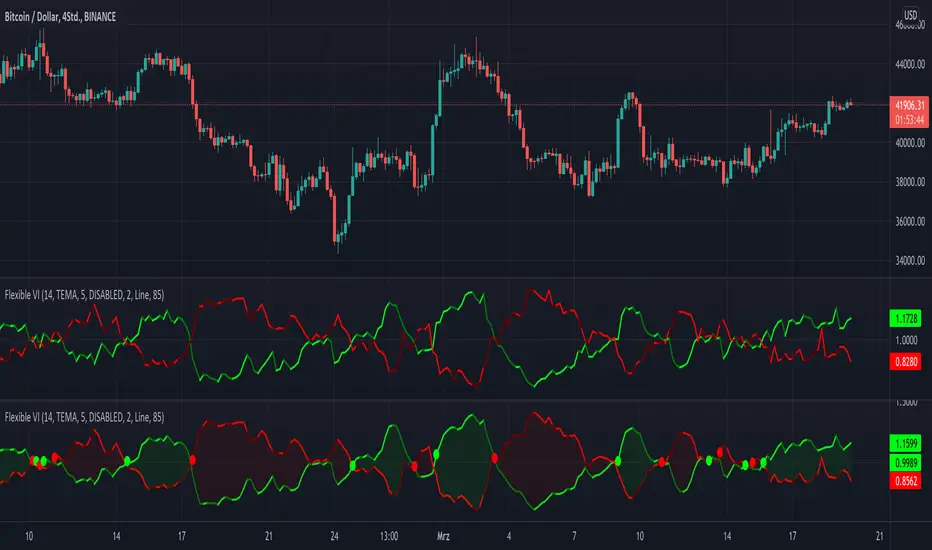
The Vortex indicator is based on two trend lines that indicate an uptrend (VI+) or a downtrend (VI-) in the current market. This can be used to determine trend reversals or confirmations of current trends and directions. The number of periods is usually between 10 and 25. This indicator has 14 periods as its default value. You can adjust this value in the settings according to your needs.
A buy signal can be interpreted when VI+ is greater than VI-. Conversely, a sell signal exists when VI+ is smaller than VI-. Whenever a "crossing point" occurs, an imminent trend change can also be anticipated. If the differences from the highs and lows become larger and larger, a breakout is to be expected.
When using this indicator, please note that VI+ and VI*crossings, especially during choppy price movements, can trigger false trading signals.
What distinguishes this Vortex indicator from others of this type?
The following settings are possible:
A buy signal can be interpreted when VI+ is greater than VI-. Conversely, a sell signal exists when VI+ is smaller than VI-. Whenever a "crossing point" occurs, an imminent trend change can also be anticipated. If the differences from the highs and lows become larger and larger, a breakout is to be expected.
When using this indicator, please note that VI+ and VI*crossings, especially during choppy price movements, can trigger false trading signals.
What distinguishes this Vortex indicator from others of this type?
- Possibility to choose between different template templates that influence the display
- Extensive setting options to emphasize upward and downward movements and cross points
The following settings are possible:
- "Length": Adjustable period / default value = 14
- "Template": "DISABLED", "Clear", "Informative" / Default value = DISABLED
- "Line: Size": Thickness of the vortex lines / default value = 2
- "Line: Style Type": Display variants (options: "Line", "Stepline") / default value = "Line".
- "Line: Up/Down Movements": Up and down movements are highlighted in color / default value = AN
- "Cross Points: On/Off": Cross points are displayed / default value = OFF
- "Bands: On/Off": Vortex lines are connected as a band / default value = OFF
- "Bands: Transparency": Strength of transparency / default value = 85
- Color codes: The color codes are explained in the settings
Sürüm Notları
- Convert to PineScript5
Sürüm Notları
- Add optional Feature 'Remove Noise: On/Off' (disabled by default) ==> Smoothing the vortex trend line for a better view
Sürüm Notları
- add new MA Type => "TEMA" (Triple EMA)
- Refactor some Parts of Code
Açık kaynak kodlu komut dosyası
Gerçek TradingView ruhuyla, bu komut dosyasının mimarı, yatırımcıların işlevselliğini inceleyip doğrulayabilmesi için onu açık kaynaklı hale getirdi. Yazarı tebrik ederiz! Ücretsiz olarak kullanabilseniz de, kodu yeniden yayınlamanın Topluluk Kurallarımıza tabi olduğunu unutmayın.
My published Scripts:
de.tradingview.com/u/KINSKI/
Appreciation of my work: paypal.com/paypalme/steffenhollstein
de.tradingview.com/u/KINSKI/
Appreciation of my work: paypal.com/paypalme/steffenhollstein
Feragatname
Bilgiler ve yayınlar, TradingView tarafından sağlanan veya onaylanan finansal, yatırım, alım satım veya diğer türden tavsiye veya öneriler anlamına gelmez ve teşkil etmez. Kullanım Koşulları bölümünde daha fazlasını okuyun.