OPEN-SOURCE SCRIPT
Güncellendi US Yield Curve (2-10yr)
US Yield Curve (2-10yr) by oonoon
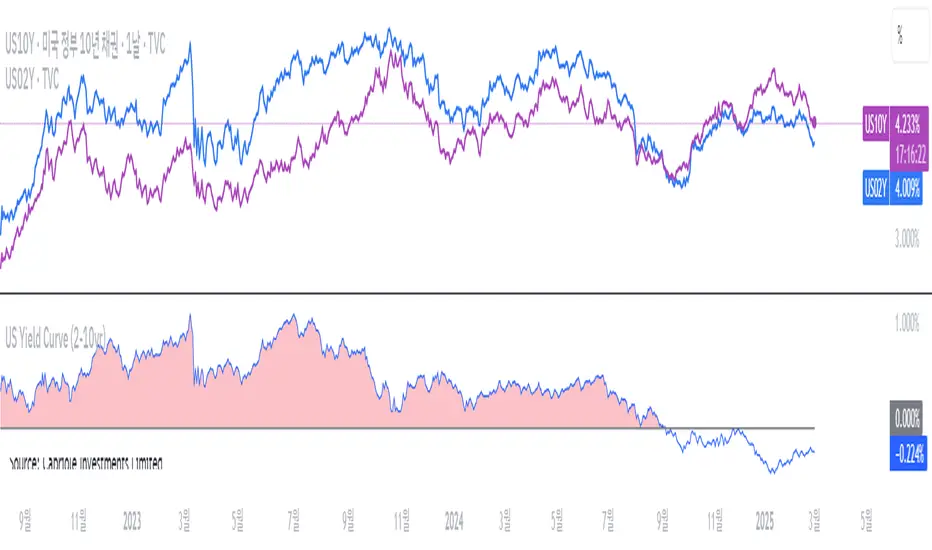
2-10Y US Yield Curve and Investment Strategies
The 2-10 year US Treasury yield spread measures the difference between the 10-year and 2-year Treasury yields. It is a key indicator of economic conditions.
Inversion (Spread < 0%): When the 2-year yield exceeds the 10-year yield, it signals a potential recession. Investors may shift to long-term bonds (TLT, ZROZ), gold (GLD), or defensive stocks.
Steepening (Spread widening): A rising 10-year yield relative to the 2-year suggests economic expansion. Investors can benefit by shorting bonds (TBT) or investing in financial stocks (XLF). The Amundi US Curve Steepening 2-10Y ETF can be used to profit from this trend.
Monitoring the curve: Traders can track US10Y-US02Y on TradingView for real-time insights and adjust portfolios accordingly.
Sürüm Notları
2-10Y US Yield Curve and Investment Strategies by oonoonThe 2-10 year US Treasury yield spread measures the difference between the 10-year and 2-year Treasury yields. It is a key indicator of economic conditions.
Inversion (Spread < 0%): When the 2-year yield exceeds the 10-year yield, it signals a potential recession. Investors may shift to long-term bonds (TLT, ZROZ), gold (GLD), or defensive stocks.
Steepening (Spread widening): A rising 10-year yield relative to the 2-year suggests economic expansion. Investors can benefit by shorting bonds (TBT) or investing in financial stocks (XLF). The Amundi US Curve Steepening 2-10Y ETF can be used to profit from this trend.
Monitoring the curve: Traders can track US10Y-US02Y on TradingView for real-time insights and adjust portfolios accordingly.
Açık kaynak kodlu komut dosyası
Gerçek TradingView ruhuyla, bu komut dosyasının mimarı, yatırımcıların işlevselliğini inceleyip doğrulayabilmesi için onu açık kaynaklı hale getirdi. Yazarı tebrik ederiz! Ücretsiz olarak kullanabilseniz de, kodu yeniden yayınlamanın Topluluk Kurallarımıza tabi olduğunu unutmayın.
Feragatname
Bilgiler ve yayınlar, TradingView tarafından sağlanan veya onaylanan finansal, yatırım, alım satım veya diğer türden tavsiye veya öneriler anlamına gelmez ve teşkil etmez. Kullanım Koşulları bölümünde daha fazlasını okuyun.