PROTECTED SOURCE SCRIPT
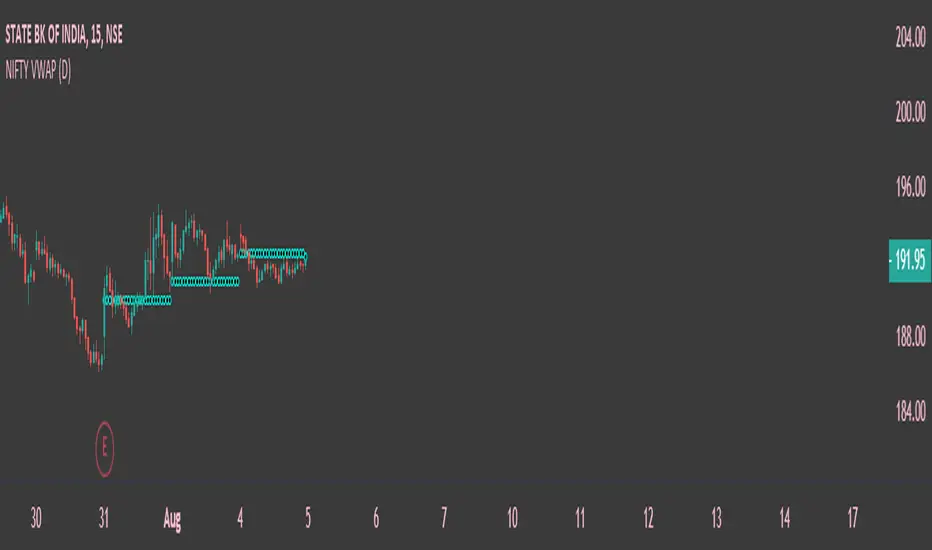
Nifty VWAP

This indicator is based on Indian Indices Nifty and Nifty 50 Stocks . Combination of breadth volumes of Niifty50 stocks to get Nifty Volume , can be used only Nifty50 Index and stocks . This indicator tells you the trend of the index or stocks. If the price is above the Volume weighted average price line its considers as Bullish Trend and if the price is below the Volume weighted average price line its considered as Bearish Trend. Default resolution is Set as Day , can be customized according to ones choice . Hope you guys will like it .
Korumalı komut dosyası
Bu komut dosyası kapalı kaynak olarak yayınlanmaktadır. Ancak, ücretsiz ve herhangi bir sınırlama olmaksızın kullanabilirsiniz – daha fazla bilgiyi buradan edinebilirsiniz.
Feragatname
Bilgiler ve yayınlar, TradingView tarafından sağlanan veya onaylanan finansal, yatırım, alım satım veya diğer türden tavsiye veya öneriler anlamına gelmez ve teşkil etmez. Kullanım Koşulları bölümünde daha fazlasını okuyun.