OPEN-SOURCE SCRIPT
Price equilibrium between buyers and sellers [Soroush Rezaei]
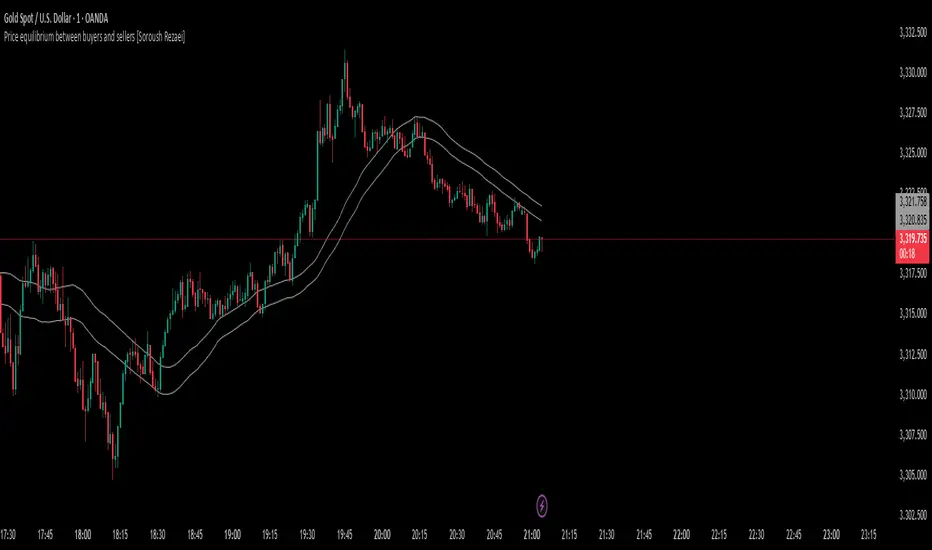
This indicator visualizes the dynamic balance between buyers and sellers using two simple moving averages (SMAs) based on the high and low prices.
The green line (SMA of highs) reflects the upper pressure zone, while the red line (SMA of lows) represents the lower support zone.
When price hovers between these two levels, it often signals a state of temporary equilibrium — a consolidation zone where buyers and sellers are relatively balanced.
Use this tool to:
Recommended for intraday and swing traders seeking visual clarity on market structure and momentum zones.
The green line (SMA of highs) reflects the upper pressure zone, while the red line (SMA of lows) represents the lower support zone.
When price hovers between these two levels, it often signals a state of temporary equilibrium — a consolidation zone where buyers and sellers are relatively balanced.
Use this tool to:
- Identify ranging or balanced market phases
- Spot potential breakout or reversal zones
- Enhance your multi-timeframe or price action strategy
Recommended for intraday and swing traders seeking visual clarity on market structure and momentum zones.
Açık kaynak kodlu komut dosyası
Gerçek TradingView ruhuyla, bu komut dosyasının yaratıcısı, yatırımcıların işlevselliğini inceleyip doğrulayabilmesi için onu açık kaynaklı hale getirdi. Yazarı tebrik ederiz! Ücretsiz olarak kullanabilseniz de, kodu yeniden yayınlamanın Topluluk Kurallarımıza tabi olduğunu unutmayın.
Feragatname
Bilgiler ve yayınlar, TradingView tarafından sağlanan veya onaylanan finansal, yatırım, alım satım veya diğer türden tavsiye veya öneriler anlamına gelmez ve teşkil etmez. Kullanım Koşulları bölümünde daha fazlasını okuyun.