OPEN-SOURCE SCRIPT
Cross-Correlation Lead/Lag Analyzer

Cross-Correlation Lead/Lag Analyzer (XCorr)
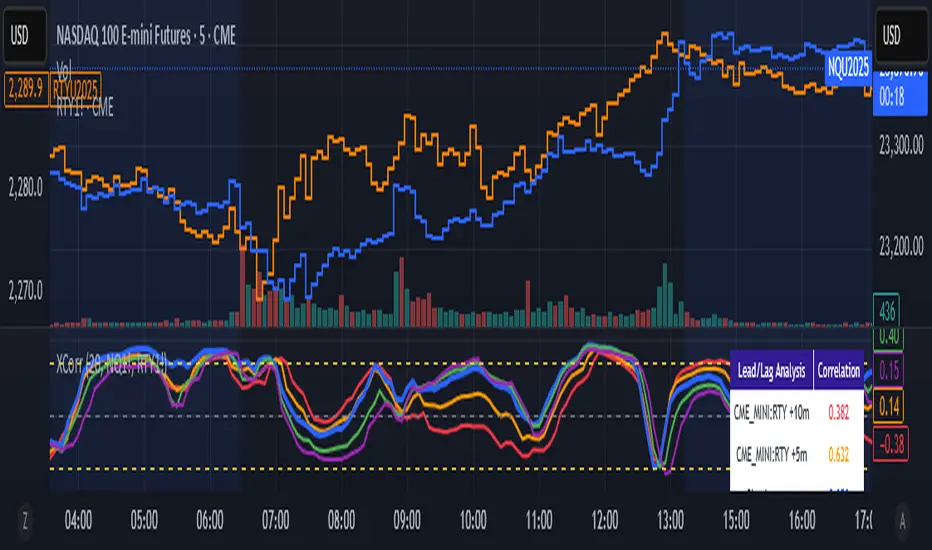
Discover which instrument moves first with advanced cross-correlation analysis.
This indicator analyzes the lead/lag relationship between any two financial instruments using rolling cross-correlation at multiple time offsets. Perfect for pairs trading, market timing, and understanding inter-market relationships.
Key Features:
How to Use:
Interpreting Results:
Popular Use Cases:
Technical Notes:
Cross-correlation measures linear relationships between two time series at different time lags. This implementation uses Pearson correlation with adjustable periods, calculating correlations from -2 to +2 period offsets to detect leading/lagging behavior.
Perfect for quantitative analysts, pairs traders, and anyone studying inter-market relationships.
Discover which instrument moves first with advanced cross-correlation analysis.
This indicator analyzes the lead/lag relationship between any two financial instruments using rolling cross-correlation at multiple time offsets. Perfect for pairs trading, market timing, and understanding inter-market relationships.
Key Features:
- Universal compatibility - Works with any two symbols (stocks, futures, forex, crypto, commodities)
- Multi-timeframe analysis - Automatically adjusts lag periods based on your chart timeframe
- Real-time correlation table - Shows current correlation values for all lag scenarios
- Visual lead/lag detection - Color-coded plots make it easy to spot which instrument leads
- Smart "Best" indicator - Automatically identifies the strongest relationship
How to Use:
- Set your symbols in the indicator settings (default: NQ1! vs RTY1!)
- Adjust correlation length (default: 20 periods for smooth but responsive analysis)
- Watch the colored lines:
• Red/Orange: Symbol 2 leads Symbol 1 by 1-2 periods
• Blue: Instruments move simultaneously
• Green/Purple: Symbol 1 leads Symbol 2 by 1-2 periods - Check the table for exact correlation values and the "Best" relationship
Interpreting Results:
- Correlation > 0.7: Strong positive relationship
- Correlation 0.3-0.7: Moderate relationship
- Correlation < 0.3: Weak/no relationship
- Highest line indicates the optimal timing relationship
Popular Use Cases:
- Index Futures: NQ vs ES, RTY vs IWM
- Sector Rotation: XLF vs XLK, QQQ vs SPY
- Commodities: GC vs SI, CL vs NG
- Currency Pairs: EURUSD vs GBPUSD
- Crypto: BTC vs ETH correlation analysis
Technical Notes:
Cross-correlation measures linear relationships between two time series at different time lags. This implementation uses Pearson correlation with adjustable periods, calculating correlations from -2 to +2 period offsets to detect leading/lagging behavior.
Perfect for quantitative analysts, pairs traders, and anyone studying inter-market relationships.
Açık kaynak kodlu komut dosyası
Gerçek TradingView ruhuyla, bu komut dosyasının mimarı, yatırımcıların işlevselliğini inceleyip doğrulayabilmesi için onu açık kaynaklı hale getirdi. Yazarı tebrik ederiz! Ücretsiz olarak kullanabilseniz de, kodu yeniden yayınlamanın Topluluk Kurallarımıza tabi olduğunu unutmayın.
Feragatname
Bilgiler ve yayınlar, TradingView tarafından sağlanan veya onaylanan finansal, yatırım, alım satım veya diğer türden tavsiye veya öneriler anlamına gelmez ve teşkil etmez. Kullanım Koşulları bölümünde daha fazlasını okuyun.