OPEN-SOURCE SCRIPT
Consecutive Candles DevisSo
Hi Traders !!!
Level Calculation:
50% and 23.6% Fibonacci levels are calculated based on the open and close of the previous candles.
Consecutive Candle Check:
For an uptrend: Each candle's low must not touch the 50% levels of the previous candles.
For a downtrend: Each candle's high must not touch the 50% levels of the previous candles.
Pullback Level:
When a long signal is triggered, the current candle's low is recorded as a pullback level.
When a short signal is triggered, the current candle's high is recorded as a pullback level.
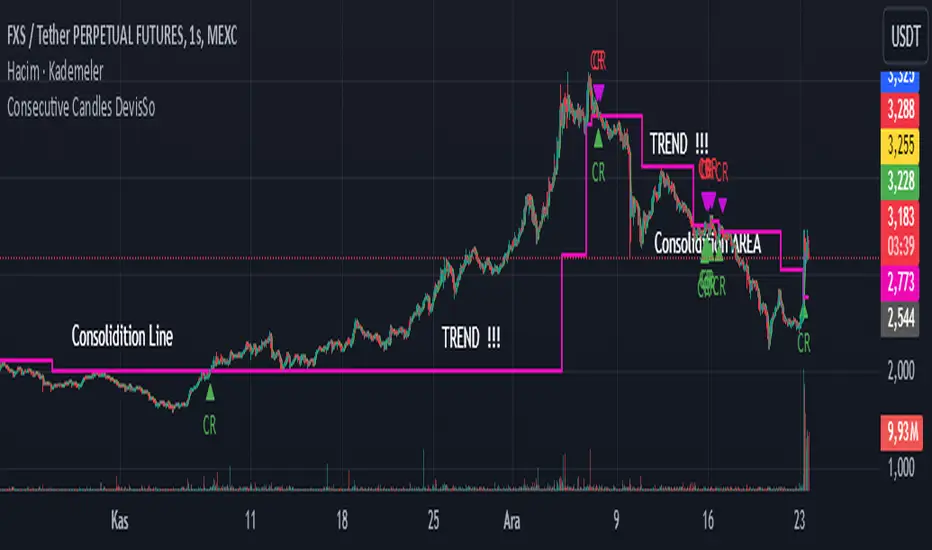
Breakout and Signal Generation:
If the price breaks above the calculated level, a long signal is generated; if it breaks below, a short signal is generated.
These signals are visualized on the chart.
Continuity:
The system checks the last signal to ensure the validity of new signals, maintaining the consistency of consecutive signals.
Level Calculation:
50% and 23.6% Fibonacci levels are calculated based on the open and close of the previous candles.
Consecutive Candle Check:
For an uptrend: Each candle's low must not touch the 50% levels of the previous candles.
For a downtrend: Each candle's high must not touch the 50% levels of the previous candles.
Pullback Level:
When a long signal is triggered, the current candle's low is recorded as a pullback level.
When a short signal is triggered, the current candle's high is recorded as a pullback level.
Breakout and Signal Generation:
If the price breaks above the calculated level, a long signal is generated; if it breaks below, a short signal is generated.
These signals are visualized on the chart.
Continuity:
The system checks the last signal to ensure the validity of new signals, maintaining the consistency of consecutive signals.
Açık kaynak kodlu komut dosyası
Gerçek TradingView ruhuyla, bu komut dosyasının mimarı, yatırımcıların işlevselliğini inceleyip doğrulayabilmesi için onu açık kaynaklı hale getirdi. Yazarı tebrik ederiz! Ücretsiz olarak kullanabilseniz de, kodu yeniden yayınlamanın Topluluk Kurallarımıza tabi olduğunu unutmayın.
Feragatname
Bilgiler ve yayınlar, TradingView tarafından sağlanan veya onaylanan finansal, yatırım, alım satım veya diğer türden tavsiye veya öneriler anlamına gelmez ve teşkil etmez. Kullanım Koşulları bölümünde daha fazlasını okuyun.