PROTECTED SOURCE SCRIPT
π Cycle Market Tops & Bottoms Performante Indicator
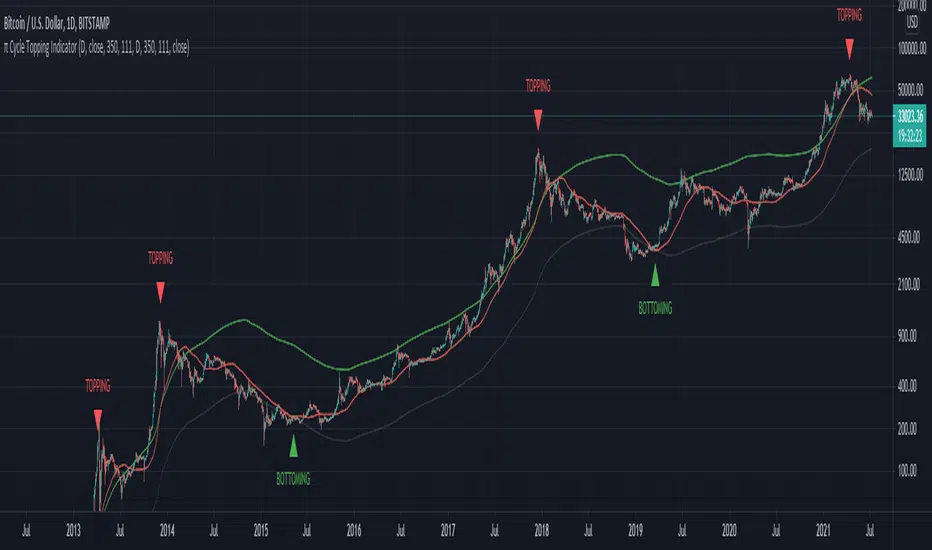
Why is it called the Pi Cycle Tops & Bottoms Indicator?
When the 111-Day moving average crosses over the (350-Day moving average X 2), we've seen the price come to a key top or bottom within the Bitcoin market for the past 3 cycles.
350 divided by 111 is very close to π - hence the name the Pie cycle!
Yes, we are selecting arbitrary numbers initially, but through the use of proper back-testing, we are able to find key cycle shifts using mathematical numbers (fibs, Pi, etc)
We use this topping & bottoming signal when things look overbought over oversold within the market.
The "topping" label turns on as soon as we see the 111-Day moving average cross above the 350-Day moving average.
The "bottoming" signal turns on as soon as we see the 111-day moving average cross below the 350-Day moving average.
This indicator should only be used on the daily timeframe!
Historically speaking, we've seen this indicator become impressively accurate.
Korumalı komut dosyası
Bu komut dosyası kapalı kaynak olarak yayınlanmaktadır. Ancak, ücretsiz ve herhangi bir sınırlama olmaksızın kullanabilirsiniz – daha fazla bilgiyi buradan edinebilirsiniz.
Feragatname
Bilgiler ve yayınlar, TradingView tarafından sağlanan veya onaylanan finansal, yatırım, alım satım veya diğer türden tavsiye veya öneriler anlamına gelmez ve teşkil etmez. Kullanım Koşulları bölümünde daha fazlasını okuyun.