OPEN-SOURCE SCRIPT
Güncellendi liquidity volume

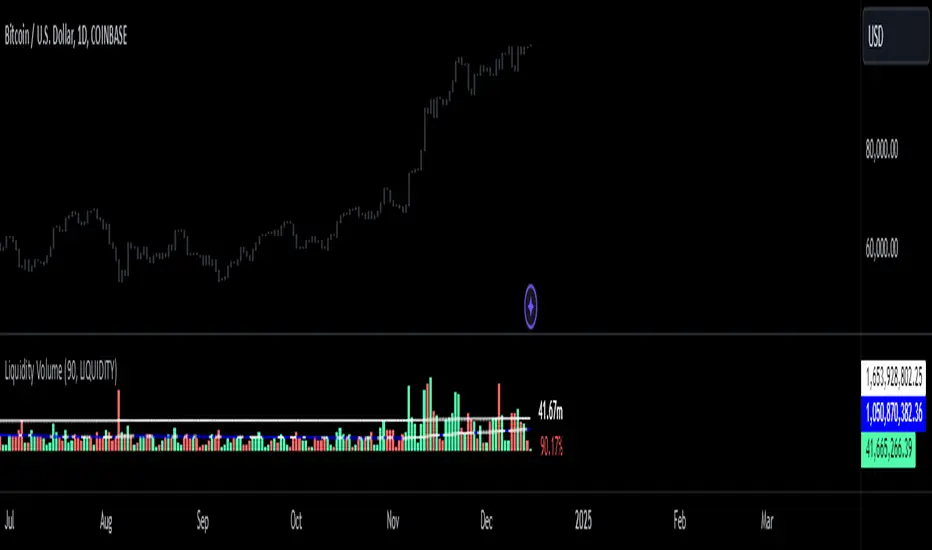
just like volume, this indicator shows how much in dollars were traded in millions.
Sürüm Notları
made the volume bars represent colors based on bearish or bullish movementSürüm Notları
added a mean (average) to the script. Sürüm Notları
added a 3rd standard deviation to the indicator. a 3sd occurrence has a 0.2% chance of occurrence on a statistical standpoint. but when it comes to markets it happens more often. nonetheless, a 3sd alert can signify a major market movement due to increase of activity of dollars going in or out of that asset you are observing. P.S.A. go on settings, under style tab, change the "price line" to a histogram. Sürüm Notları
changed the plotted liqudity to a column Sürüm Notları
when the line is purple that means that liquidity is going down. when the line is white that means liquidity is going up Sürüm Notları
ive made improvements on the script. easier to use and readSürüm Notları
made a little bit more modificationSürüm Notları
you can switch from representation of liquidity and equity. equity is just normal volumeSürüm Notları
we have added a new stat. you can see how much volume has increased/decreased from the previous bar in percentageSürüm Notları
modified the separation of labels so no overlapping occursSürüm Notları
Açık kaynak kodlu komut dosyası
Gerçek TradingView ruhuyla, bu komut dosyasının mimarı, yatırımcıların işlevselliğini inceleyip doğrulayabilmesi için onu açık kaynaklı hale getirdi. Yazarı tebrik ederiz! Ücretsiz olarak kullanabilseniz de, kodu yeniden yayınlamanın Topluluk Kurallarımıza tabi olduğunu unutmayın.
Feragatname
Bilgiler ve yayınlar, TradingView tarafından sağlanan veya onaylanan finansal, yatırım, alım satım veya diğer türden tavsiye veya öneriler anlamına gelmez ve teşkil etmez. Kullanım Koşulları bölümünde daha fazlasını okuyun.