PROTECTED SOURCE SCRIPT
Adaptive Scalping with Take Profit
This is a comprehensive and adaptive trading system designed specifically for scalping XAUUSD (Gold) on a 3-minute timeframe. Its main feature is that it "adapts" to current market conditions rather than using fixed parameters. It provides clear BUY, SELL, and EXIT signals directly on the chart.
Key Components
1. Adaptive Entry Signal (KAMA)
Instead of using standard moving averages (like EMA or SMA), the entry logic is based on Kaufman's Adaptive Moving Average (KAMA).
How it's adaptive: KAMA automatically adjusts its speed based on market noise. It moves slowly when the market is choppy and sideways, filtering out many false signals. It speeds up when a clear trend emerges, allowing you to enter a move early.
A BUY signal is generated when the faster KAMA crosses above the slower KAMA. A SELL signal is generated on a cross-under.
2. Volatility Filter
The system includes an optional filter that uses the Average True Range (ATR) to measure market volatility.
A trade signal will only appear if the market is volatile enough for scalping. This prevents you from entering trades when the market is flat and there's little opportunity for profit.
3. Dual Exit Strategy (Adaptive)
This is the most advanced part of the system. It gives you two ways to exit a trade to maximize and protect profits:
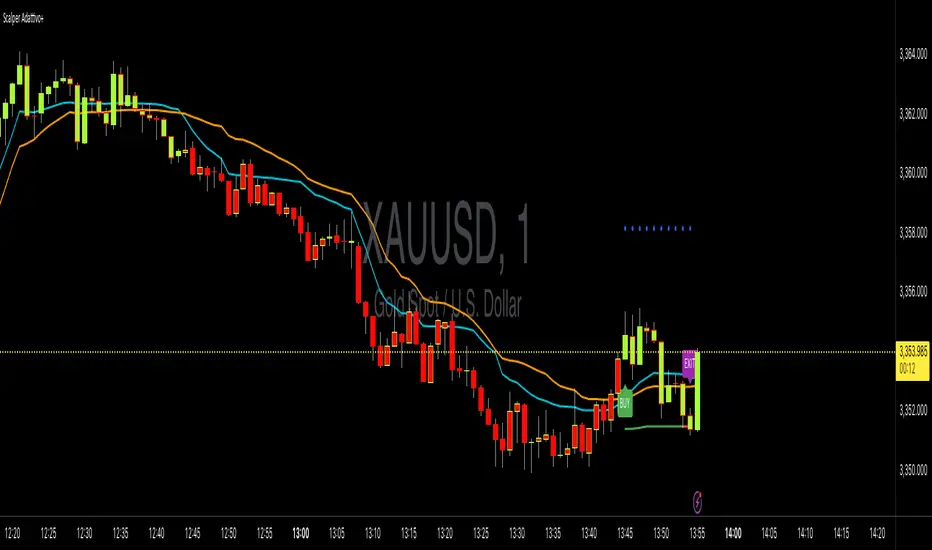
Dynamic Take Profit: When a trade starts, a profit target (the blue circles) is immediately plotted on the chart. This target is calculated using the ATR, so on a volatile day, the target will be further away. If the price hits this level, it's a signal to take your profits.
ATR Trailing Stop: This is your safety net. It's a stop loss that automatically "trails" behind the price as it moves in your favor (the green/red line). If the market suddenly reverses, the trade is closed when the price hits this trailing stop, locking in any accumulated profit.
An EXIT label appears on the chart as soon as one of these two conditions is met.
4. On-Chart Visuals
BUY/SELL/EXIT Labels: Clear, unmissable labels appear to show you exactly when to enter and exit.
Bar Coloring: The chart candles are colored green when the trend is bullish (fast KAMA > slow KAMA) and red when the trend is bearish, giving you an instant visual confirmation of the market sentiment.
Key Components
1. Adaptive Entry Signal (KAMA)
Instead of using standard moving averages (like EMA or SMA), the entry logic is based on Kaufman's Adaptive Moving Average (KAMA).
How it's adaptive: KAMA automatically adjusts its speed based on market noise. It moves slowly when the market is choppy and sideways, filtering out many false signals. It speeds up when a clear trend emerges, allowing you to enter a move early.
A BUY signal is generated when the faster KAMA crosses above the slower KAMA. A SELL signal is generated on a cross-under.
2. Volatility Filter
The system includes an optional filter that uses the Average True Range (ATR) to measure market volatility.
A trade signal will only appear if the market is volatile enough for scalping. This prevents you from entering trades when the market is flat and there's little opportunity for profit.
3. Dual Exit Strategy (Adaptive)
This is the most advanced part of the system. It gives you two ways to exit a trade to maximize and protect profits:
Dynamic Take Profit: When a trade starts, a profit target (the blue circles) is immediately plotted on the chart. This target is calculated using the ATR, so on a volatile day, the target will be further away. If the price hits this level, it's a signal to take your profits.
ATR Trailing Stop: This is your safety net. It's a stop loss that automatically "trails" behind the price as it moves in your favor (the green/red line). If the market suddenly reverses, the trade is closed when the price hits this trailing stop, locking in any accumulated profit.
An EXIT label appears on the chart as soon as one of these two conditions is met.
4. On-Chart Visuals
BUY/SELL/EXIT Labels: Clear, unmissable labels appear to show you exactly when to enter and exit.
Bar Coloring: The chart candles are colored green when the trend is bullish (fast KAMA > slow KAMA) and red when the trend is bearish, giving you an instant visual confirmation of the market sentiment.
Korumalı komut dosyası
Bu komut dosyası kapalı kaynak olarak yayınlanmaktadır. Ancak, ücretsiz ve herhangi bir sınırlama olmaksızın kullanabilirsiniz – daha fazla bilgiyi buradan edinebilirsiniz.
Feragatname
Bilgiler ve yayınlar, TradingView tarafından sağlanan veya onaylanan finansal, yatırım, alım satım veya diğer türden tavsiye veya öneriler anlamına gelmez ve teşkil etmez. Kullanım Koşulları bölümünde daha fazlasını okuyun.