OPEN-SOURCE SCRIPT
Breakout Josip
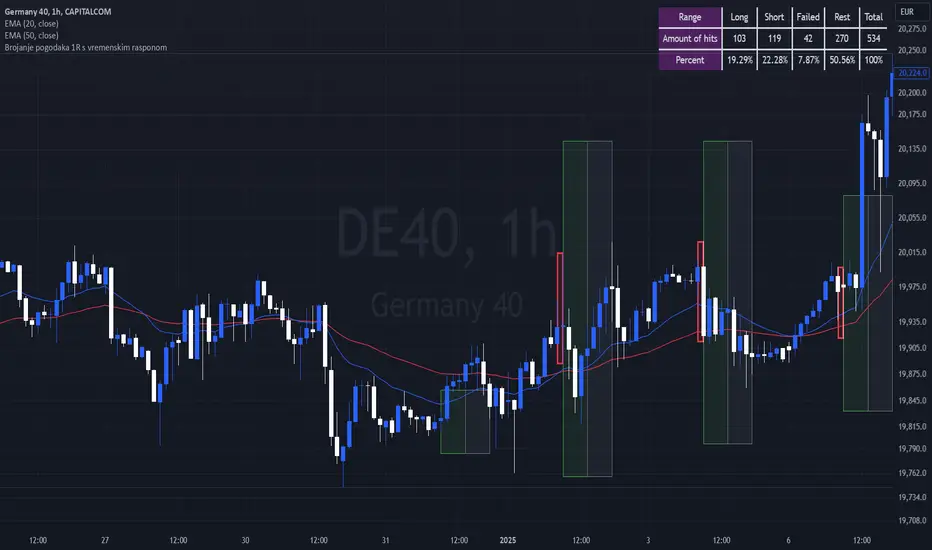
strategy is focused on analyzing price movements during specific time intervals (from 9:00 AM to 12:00 PM) each day. It tracks the highest and lowest prices in that period and uses them to set targets for potential trades, placing horizontal lines based on these levels. Additionally, you're interested in tracking the success and failure of trades based on whether price breaks certain levels during this time range. The strategy also calculates various metrics like the percentage of successful trades, failed trades, and total trades during a selected time range.
Açık kaynak kodlu komut dosyası
Gerçek TradingView ruhuyla, bu komut dosyasının mimarı, yatırımcıların işlevselliğini inceleyip doğrulayabilmesi için onu açık kaynaklı hale getirdi. Yazarı tebrik ederiz! Ücretsiz olarak kullanabilseniz de, kodu yeniden yayınlamanın Topluluk Kurallarımıza tabi olduğunu unutmayın.
Feragatname
Bilgiler ve yayınlar, TradingView tarafından sağlanan veya onaylanan finansal, yatırım, alım satım veya diğer türden tavsiye veya öneriler anlamına gelmez ve teşkil etmez. Kullanım Koşulları bölümünde daha fazlasını okuyun.