OPEN-SOURCE SCRIPT
Güncellendi Heiken Ashi Lower Pane
Not one of my more challenging scripts, never the less I was requested to publish this open source indicator.
Heiken Ashi (HA) candles indicate strength usually when the candles have wicks in the direction of the movement, ie. top wicks on green candles w/NO wicks on bottom and vice versa for bearish behavior (bottom wicks on red candles). Weakness in the movement CAN be spotted by watching for wicks opposite the movement appearing.
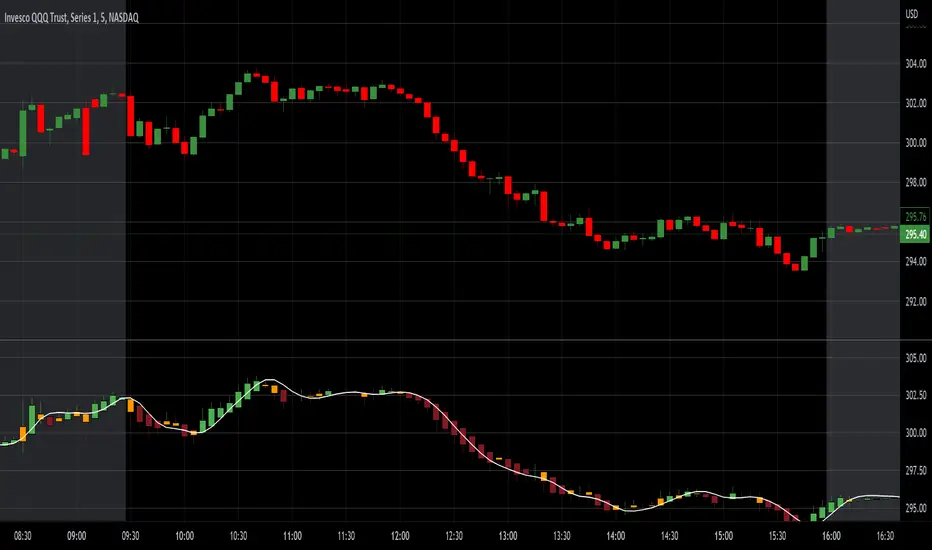
This indicator can be used in a lower pane to show heiken ashi candles concurrently with above main chart regular candles.
Nothing special about it other than displaying bull/bear ha candles with a twist of third color candle (orange default) which is shown when HA candle gets a wick in opposite direction of movement which usually indicates potential directional weakness.
It also provides various moving average line types based upon the HA high, low, close, open values (HLC4) that can used if you are into watching for a cross over of the HA candle to a MA line.
Note: You can also display this over the main chart as an overlay just by selecting the three dots on the indicator and "Move to" option. Be advised doing so will probably cause too much overlapping onto the regular candles.
Heiken Ashi (HA) candles indicate strength usually when the candles have wicks in the direction of the movement, ie. top wicks on green candles w/NO wicks on bottom and vice versa for bearish behavior (bottom wicks on red candles). Weakness in the movement CAN be spotted by watching for wicks opposite the movement appearing.
This indicator can be used in a lower pane to show heiken ashi candles concurrently with above main chart regular candles.
Nothing special about it other than displaying bull/bear ha candles with a twist of third color candle (orange default) which is shown when HA candle gets a wick in opposite direction of movement which usually indicates potential directional weakness.
It also provides various moving average line types based upon the HA high, low, close, open values (HLC4) that can used if you are into watching for a cross over of the HA candle to a MA line.
Note: You can also display this over the main chart as an overlay just by selecting the three dots on the indicator and "Move to" option. Be advised doing so will probably cause too much overlapping onto the regular candles.
Sürüm Notları
Fixed Bugs regarding timeframes and added multi time frame options.Açık kaynak kodlu komut dosyası
Gerçek TradingView ruhuyla, bu komut dosyasının mimarı, yatırımcıların işlevselliğini inceleyip doğrulayabilmesi için onu açık kaynaklı hale getirdi. Yazarı tebrik ederiz! Ücretsiz olarak kullanabilseniz de, kodu yeniden yayınlamanın Topluluk Kurallarımıza tabi olduğunu unutmayın.
Feragatname
Bilgiler ve yayınlar, TradingView tarafından sağlanan veya onaylanan finansal, yatırım, alım satım veya diğer türden tavsiye veya öneriler anlamına gelmez ve teşkil etmez. Kullanım Koşulları bölümünde daha fazlasını okuyun.
Açık kaynak kodlu komut dosyası
Gerçek TradingView ruhuyla, bu komut dosyasının mimarı, yatırımcıların işlevselliğini inceleyip doğrulayabilmesi için onu açık kaynaklı hale getirdi. Yazarı tebrik ederiz! Ücretsiz olarak kullanabilseniz de, kodu yeniden yayınlamanın Topluluk Kurallarımıza tabi olduğunu unutmayın.
Feragatname
Bilgiler ve yayınlar, TradingView tarafından sağlanan veya onaylanan finansal, yatırım, alım satım veya diğer türden tavsiye veya öneriler anlamına gelmez ve teşkil etmez. Kullanım Koşulları bölümünde daha fazlasını okuyun.