OPEN-SOURCE SCRIPT
PA ScratchiCloud
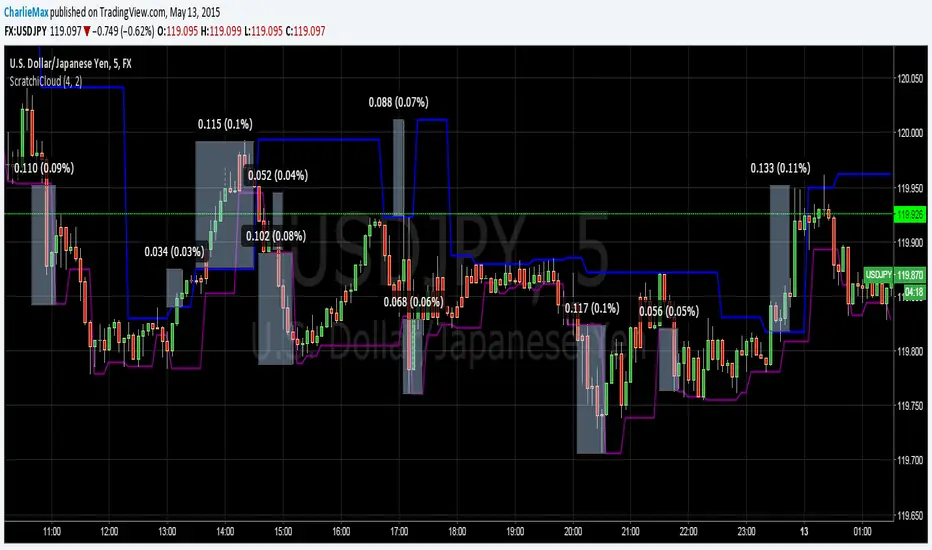
This indicator is a modification of Golgistain's Hi/Lo Pivot indicator. I added a shorter length 2 to get early entries on short positions.
The way it works is you choose a timeframe you would like to trade and then set the indicator length to match the candle price action patterns. Default is M5 chart with 4/2 for the indicators.
Rules: Take the trade when price breaks out the top or bottom of the line.
Exit: Take what you can get and give nothing back.
Good luck - CharlieMax :0)
Açık kaynak kodlu komut dosyası
Gerçek TradingView ruhuyla, bu komut dosyasının mimarı, yatırımcıların işlevselliğini inceleyip doğrulayabilmesi için onu açık kaynaklı hale getirdi. Yazarı tebrik ederiz! Ücretsiz olarak kullanabilseniz de, kodu yeniden yayınlamanın Topluluk Kurallarımıza tabi olduğunu unutmayın.
Feragatname
Bilgiler ve yayınlar, TradingView tarafından sağlanan veya onaylanan finansal, yatırım, alım satım veya diğer türden tavsiye veya öneriler anlamına gelmez ve teşkil etmez. Kullanım Koşulları bölümünde daha fazlasını okuyun.