OPEN-SOURCE SCRIPT
Güncellendi RSI & Stoch MultiTime
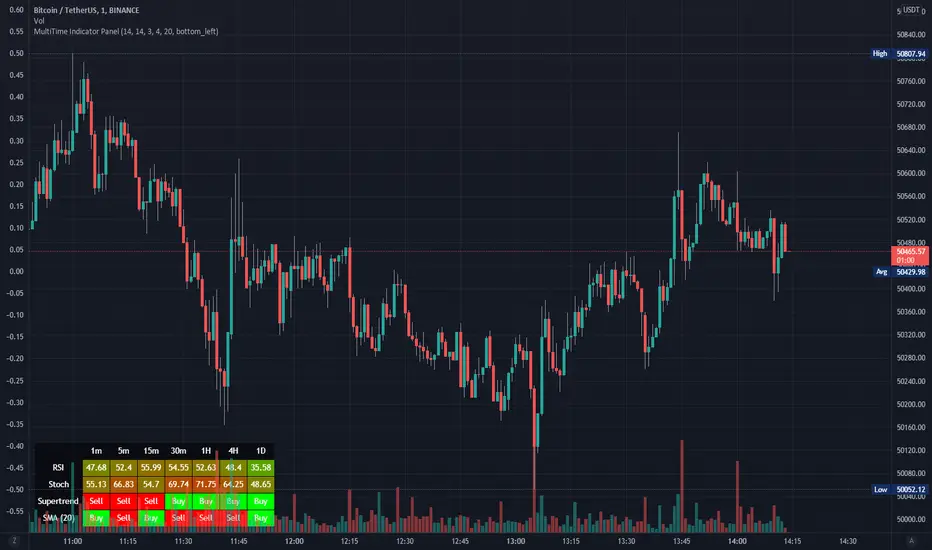
This indicator renders a table with 2 rows and 7 columns displaying the values of RSI and Stoch over different time periods. This works best on 1m charts due to a bug with the time periods I haven't yet solved.
Sürüm Notları
Updated script to support easily adding a new indicator as a signal.Added Supertrend and SMA to indicators table
You can now specify the period of each indicator in the config
Added config option for table alignment for users who want to overlay on their chart
Sürüm Notları
Fixed mistake where signal color and text was backwards.Açık kaynak kodlu komut dosyası
Gerçek TradingView ruhuyla, bu komut dosyasının mimarı, yatırımcıların işlevselliğini inceleyip doğrulayabilmesi için onu açık kaynaklı hale getirdi. Yazarı tebrik ederiz! Ücretsiz olarak kullanabilseniz de, kodu yeniden yayınlamanın Topluluk Kurallarımıza tabi olduğunu unutmayın.
🚀 Founder of SciQua | Strategy. Simulation. Signals.
TradingView indicators, backtesting tools, weekly contests, and live market analysis.
Join free, compete, win, and stay updated at sciqua.com
TradingView indicators, backtesting tools, weekly contests, and live market analysis.
Join free, compete, win, and stay updated at sciqua.com
Feragatname
Bilgiler ve yayınlar, TradingView tarafından sağlanan veya onaylanan finansal, yatırım, alım satım veya diğer türden tavsiye veya öneriler anlamına gelmez ve teşkil etmez. Kullanım Koşulları bölümünde daha fazlasını okuyun.
Açık kaynak kodlu komut dosyası
Gerçek TradingView ruhuyla, bu komut dosyasının mimarı, yatırımcıların işlevselliğini inceleyip doğrulayabilmesi için onu açık kaynaklı hale getirdi. Yazarı tebrik ederiz! Ücretsiz olarak kullanabilseniz de, kodu yeniden yayınlamanın Topluluk Kurallarımıza tabi olduğunu unutmayın.
🚀 Founder of SciQua | Strategy. Simulation. Signals.
TradingView indicators, backtesting tools, weekly contests, and live market analysis.
Join free, compete, win, and stay updated at sciqua.com
TradingView indicators, backtesting tools, weekly contests, and live market analysis.
Join free, compete, win, and stay updated at sciqua.com
Feragatname
Bilgiler ve yayınlar, TradingView tarafından sağlanan veya onaylanan finansal, yatırım, alım satım veya diğer türden tavsiye veya öneriler anlamına gelmez ve teşkil etmez. Kullanım Koşulları bölümünde daha fazlasını okuyun.