ProfitBee59 v5.0
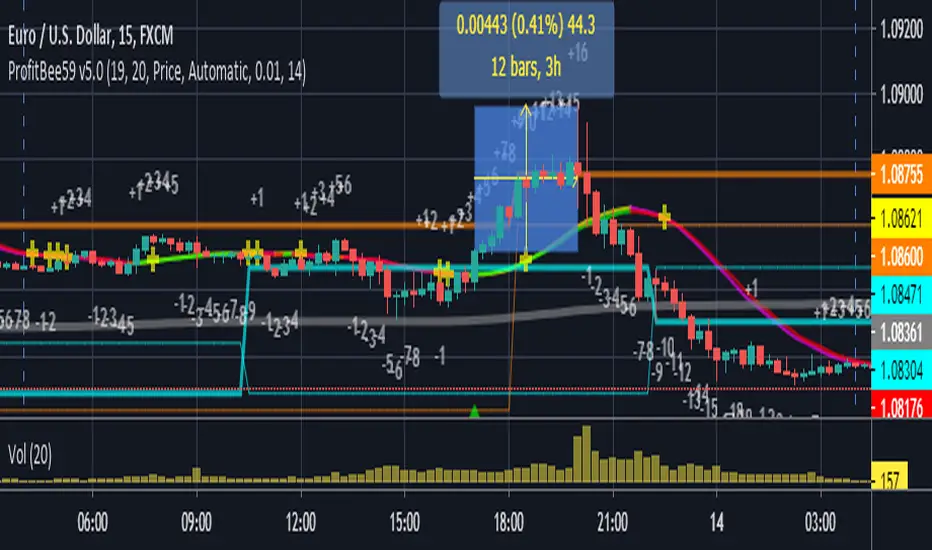
For Forex trading, other intraday parameters are also available including the day opening level, high/low of yesterday and intraday brown background marking time interval for key trading hours in Asian-London-New York markets.
Smart phone/tablet and PC notifications of events occurring in the chart can be sent to you by server-side alerts so that you don't have to stay in front of the screen all the time.
=================================================================
The script ProfitBee59 v5.0 for TradingView (pb5 ai) is locked and protected. Contact the author for your access.
=================================================================
How to install the script:
------------------------------
*Go to the bottom of this page and click on "Add to Favorite Scripts".
*Remove older version of the script by clicking on the "X" button behind the indicator line at the top left corner of the chart window.
*Open a new chart at and click on the "Indicators" tab.
*Click on the "Favorites" tab and choose "ProfitBee59 v5.0".
*Right click anywhere on the graph, choose "Color Theme", the select "Dark".
*Right click anywhere on the graph, choose "Settings".
*In "Symbol" tab, set "Precision" to 1/100 for stock price or 1/100000 for Forex and set "Time Zone" to your local time.
*In "Scales" tab, check "Indicator Last Value Label".
*In "Events" tab, check "Show Dividends on Chart", "Show Splits on Chart" and "Show Earnings on Chart".
*At the bottom of settings window, click on "Template", "Save As...", then name this theme of graph setting for future call up such as "My chart setting".
*Click OK.
Yalnızca davetli komut dosyası
Bu komut dosyasına yalnızca yazar tarafından yetkilendirilen kullanıcılar erişebilir ve bu genellikle ödeme gerektirir. Bu komut dosyasını favorilerinize ekleyebilirsiniz, ancak yalnızca yazarından izin istedikten ve aldıktan sonra kullanabilirsiniz — daha fazla bilgi burada. Daha fazla ayrıntı için yazarın aşağıdaki talimatlarını izleyin veya doğrudan nimit.chomnawang ile iletişime geçin.
TradingView, yazarına tam olarak güvenmediğiniz ve nasıl çalıştığını anlamadığınız sürece bir komut dosyası için ödeme yapmanızı veya kullanmanızı ÖNERMEZ. Ayrıca topluluk komut dosyaları bölümümüzde ücretsiz, açık kaynaklı alternatifler bulabilirsiniz.
Yazarın talimatları
Uyarı: Erişim talebinde bulunmadan önce lütfen yalnızca davetli komut dosyaları kılavuzumuzu okuyun.
Please do not ask about access to use scripts in the script's comment section.
Feragatname
Yalnızca davetli komut dosyası
Bu komut dosyasına yalnızca yazar tarafından yetkilendirilen kullanıcılar erişebilir ve bu genellikle ödeme gerektirir. Bu komut dosyasını favorilerinize ekleyebilirsiniz, ancak yalnızca yazarından izin istedikten ve aldıktan sonra kullanabilirsiniz — daha fazla bilgi burada. Daha fazla ayrıntı için yazarın aşağıdaki talimatlarını izleyin veya doğrudan nimit.chomnawang ile iletişime geçin.
TradingView, yazarına tam olarak güvenmediğiniz ve nasıl çalıştığını anlamadığınız sürece bir komut dosyası için ödeme yapmanızı veya kullanmanızı ÖNERMEZ. Ayrıca topluluk komut dosyaları bölümümüzde ücretsiz, açık kaynaklı alternatifler bulabilirsiniz.
Yazarın talimatları
Uyarı: Erişim talebinde bulunmadan önce lütfen yalnızca davetli komut dosyaları kılavuzumuzu okuyun.
Please do not ask about access to use scripts in the script's comment section.