OPEN-SOURCE SCRIPT
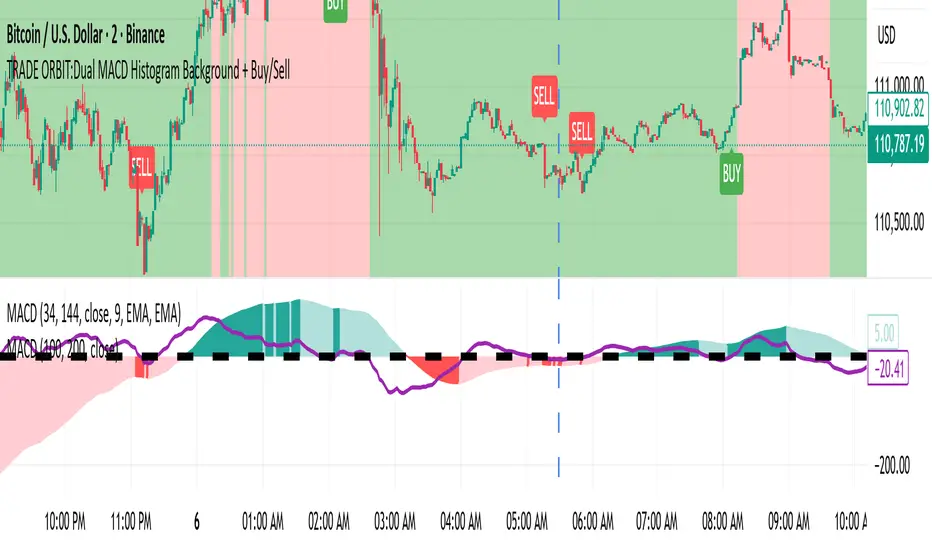
TRADE ORBIT:Dual MACD Histogram Background + Buy/Sell
Description:
This indicator combines two MACD systems to provide clear trend, buy/sell signals, and identifies potential discount and premium zones for smarter entries and exits.
Features:
MACD #1 (100, 200, 50) – Trend & Background Coloring
Histogram > 0 → Green background (Bullish trend)
Histogram < 0 → Red background (Bearish trend)
MACD #2 (34, 144, 9) – Buy/Sell Signals
Buy Signal: Histogram crosses above zero and MACD #1 background is green
Sell Signal: Histogram crosses below zero and MACD #1 background is red
Signals are plotted as tiny labels directly on the chart
Discount & Premium Zones
Discount Zone: Price below MACD #1 slow EMA → highlighted in green
Premium Zone: Price above MACD #1 slow EMA → highlighted in red
Helps identify “cheap” (potential buy) and “expensive” (potential sell) areas relative to trend
Reference Plots (Optional)
MACD #1 & #2 histograms plotted as columns for visual confirmation
Usage:
Use MACD #1 background to identify the prevailing trend.
Wait for MACD #2 cross signals aligned with trend for buy/sell confirmation.
Discount and premium zones help time entries and exits more efficiently.
Ideal For:
Swing traders and position traders who want to combine trend-following signals with overbought/oversold zones.
Açık kaynak kodlu komut dosyası
Gerçek TradingView ruhuna uygun olarak, bu komut dosyasının oluşturucusu bunu açık kaynaklı hale getirmiştir, böylece yatırımcılar betiğin işlevselliğini inceleyip doğrulayabilir. Yazara saygı! Ücretsiz olarak kullanabilirsiniz, ancak kodu yeniden yayınlamanın Site Kurallarımıza tabi olduğunu unutmayın.
Feragatname
Bilgiler ve yayınlar, TradingView tarafından sağlanan veya onaylanan finansal, yatırım, işlem veya diğer türden tavsiye veya tavsiyeler anlamına gelmez ve teşkil etmez. Kullanım Şartları'nda daha fazlasını okuyun.