PROTECTED SOURCE SCRIPT
RSI de Loquy
Indicator Description: RSI de Loquy
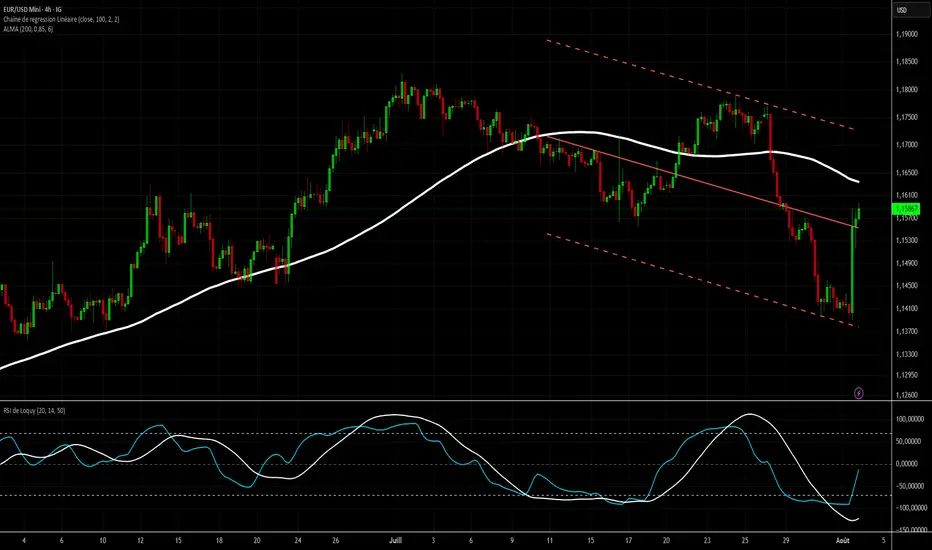
This custom indicator blends the power of the Relative Strength Index (RSI) with the Hull Moving Average (HMA), enhanced by a linear regression to reveal underlying momentum trends.
How It Works:
The RSI is calculated not on price directly, but on the HMA, offering a smoother and more responsive signal.
The RSI is remapped to a -100 to +100 scale for more intuitive reading:
+100 = extreme oversold
-100 = extreme overbought
A linear regression line is plotted over the rescaled RSI to highlight trend direction and strength.
Usage Tips:
Reversed overbought/oversold levels:
Above +70 = potential oversold condition
Below -70 = potential overbought condition
The white regression line helps confirm trend shifts or momentum continuation.
⚙️ Customizable Inputs:
HMA period
RSI length
Regression length
Korumalı komut dosyası
Bu komut dosyası kapalı kaynak olarak yayınlanmaktadır. Ancak, ücretsiz ve herhangi bir sınırlama olmaksızın kullanabilirsiniz – daha fazla bilgiyi buradan edinebilirsiniz.
Feragatname
Bilgiler ve yayınlar, TradingView tarafından sağlanan veya onaylanan finansal, yatırım, alım satım veya diğer türden tavsiye veya öneriler anlamına gelmez ve teşkil etmez. Kullanım Koşulları bölümünde daha fazlasını okuyun.