PROTECTED SOURCE SCRIPT
Güncellendi Daily Fibonacci Levels [Asa]
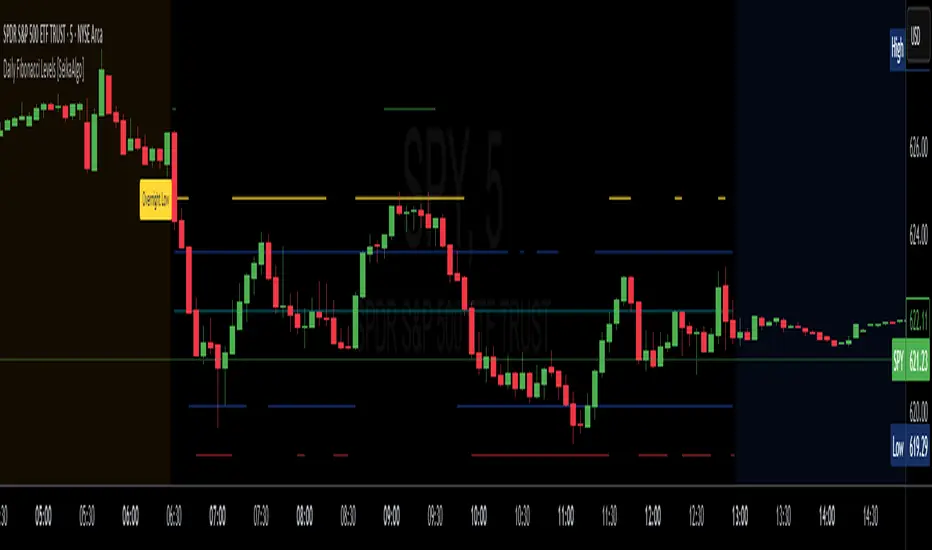
This indicator plots dynamic daily Fibonacci levels based on the overnight session high and low, helping traders identify key price zones for potential reversals, breakouts, and pullbacks during the regular trading session.
Key Features:
Use Case:
Ideal for intraday and swing traders who rely on overnight price action to map out key Fibonacci levels before and during the trading day. This tool helps quickly identify zones of confluence, potential resistance/support, and continuation levels.
Customization Options:
Key Features:
- Overnight Session High/Low Detection: Automatically captures the high and low between user-defined hours (default 16:00–09:30 EST).
- Day Session Levels: Fibonacci retracement and extension levels are calculated once the regular session begins (default 09:30–16:00 EST).
- Proximity Filter: Only plots levels that are within a customizable threshold of the current price to reduce chart clutter.
- Custom Styling: Choose from solid lines, crosses, or circles, and customize the line width for a personalized look.
- Mirrored Extensions: Includes both upside and downside Fibonacci extensions beyond the 100% level (up to 300%).
- Labels: Clearly marks the overnight high and low with labeled points at session start.
Use Case:
Ideal for intraday and swing traders who rely on overnight price action to map out key Fibonacci levels before and during the trading day. This tool helps quickly identify zones of confluence, potential resistance/support, and continuation levels.
Customization Options:
- Session hours and timezone
- Line width and style
- Proximity threshold for level visibility
Sürüm Notları
instruction updateKorumalı komut dosyası
Bu komut dosyası kapalı kaynak olarak yayınlanmaktadır. Ancak, ücretsiz ve herhangi bir sınırlama olmaksızın kullanabilirsiniz – daha fazla bilgiyi buradan edinebilirsiniz.
Feragatname
Bilgiler ve yayınlar, TradingView tarafından sağlanan veya onaylanan finansal, yatırım, alım satım veya diğer türden tavsiye veya öneriler anlamına gelmez ve teşkil etmez. Kullanım Koşulları bölümünde daha fazlasını okuyun.
Korumalı komut dosyası
Bu komut dosyası kapalı kaynak olarak yayınlanmaktadır. Ancak, ücretsiz ve herhangi bir sınırlama olmaksızın kullanabilirsiniz – daha fazla bilgiyi buradan edinebilirsiniz.
Feragatname
Bilgiler ve yayınlar, TradingView tarafından sağlanan veya onaylanan finansal, yatırım, alım satım veya diğer türden tavsiye veya öneriler anlamına gelmez ve teşkil etmez. Kullanım Koşulları bölümünde daha fazlasını okuyun.