OPEN-SOURCE SCRIPT
辰锋
// This Pine Script® code is subject to the terms of the Mozilla Public License 2.0 at mozilla.org/MPL/2.0/
// © chenfwng88888
//version=6
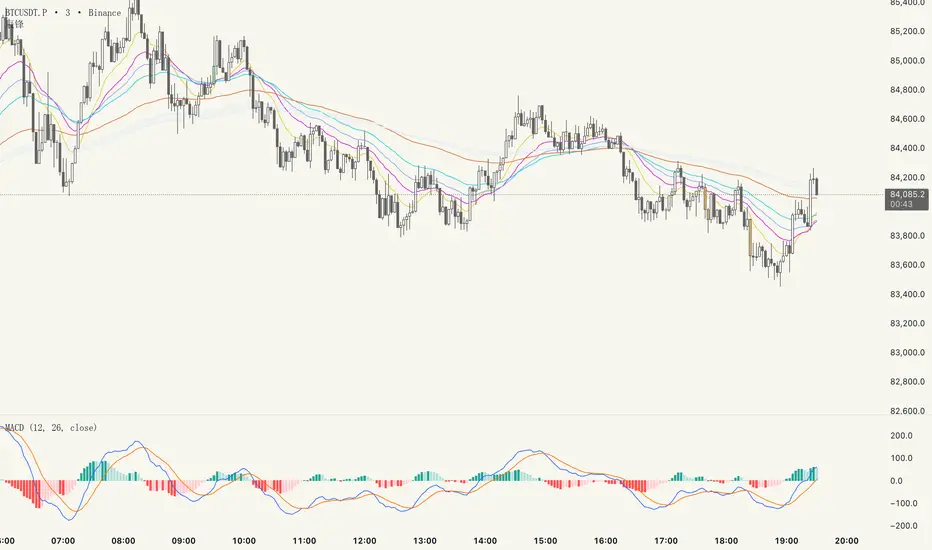
indicator("辰锋", shorttitle="辰锋", overlay=true)
// 关键EMA均线组
plot(ta.ema(close, 12), title="13", color=color.rgb(230, 202, 58), linewidth=1) // 黄色
plot(ta.ema(close, 24), title="24", color=color.rgb(208, 35, 208), linewidth=1) // 粉色
plot(ta.ema(close, 36), title="38", color=color.rgb(129, 169, 238), linewidth=1) // 墨绿
plot(ta.ema(close, 52), title="52", color=color.rgb(39, 208, 226), linewidth=1) // 蓝绿色
plot(ta.ema(close, 104), title="104", color=color.rgb(222, 109, 57), linewidth=1) // 棕色
// Vegas Channel (added EMAs)
ema144 = ta.ema(close, 144)
ema169 = ta.ema(close, 169)
plot(ema144, title="EMA 144", color=color.new(#e3ebf7, 0), linewidth=1)
plot(ema169, title="EMA 169", color=color.new(#e7e7f5, 0), linewidth=1)
// Fill between EMA 144 and EMA 169 with light blue background
fill(plot1 = plot(ema144, display=display.none),
plot2 = plot(ema169, display=display.none),
color = color.new(#deeff4, 70), title = "144-169 Area")
// Colored candles based on volume and price movement
isUp = close > open
isDown = close < open
highVolume = volume > ta.sma(volume, 50) * 3 // 50-period average + 50% threshold
// Define colors
bullishColor = color.new(#a5f1a5, 0) // Light green
bearishColor = color.new(#f2b661, 0) // Orange
// Plot candles
barcolor(isUp and highVolume ? bullishColor : isDown and highVolume ? bearishColor : na)
// © chenfwng88888
//version=6
indicator("辰锋", shorttitle="辰锋", overlay=true)
// 关键EMA均线组
plot(ta.ema(close, 12), title="13", color=color.rgb(230, 202, 58), linewidth=1) // 黄色
plot(ta.ema(close, 24), title="24", color=color.rgb(208, 35, 208), linewidth=1) // 粉色
plot(ta.ema(close, 36), title="38", color=color.rgb(129, 169, 238), linewidth=1) // 墨绿
plot(ta.ema(close, 52), title="52", color=color.rgb(39, 208, 226), linewidth=1) // 蓝绿色
plot(ta.ema(close, 104), title="104", color=color.rgb(222, 109, 57), linewidth=1) // 棕色
// Vegas Channel (added EMAs)
ema144 = ta.ema(close, 144)
ema169 = ta.ema(close, 169)
plot(ema144, title="EMA 144", color=color.new(#e3ebf7, 0), linewidth=1)
plot(ema169, title="EMA 169", color=color.new(#e7e7f5, 0), linewidth=1)
// Fill between EMA 144 and EMA 169 with light blue background
fill(plot1 = plot(ema144, display=display.none),
plot2 = plot(ema169, display=display.none),
color = color.new(#deeff4, 70), title = "144-169 Area")
// Colored candles based on volume and price movement
isUp = close > open
isDown = close < open
highVolume = volume > ta.sma(volume, 50) * 3 // 50-period average + 50% threshold
// Define colors
bullishColor = color.new(#a5f1a5, 0) // Light green
bearishColor = color.new(#f2b661, 0) // Orange
// Plot candles
barcolor(isUp and highVolume ? bullishColor : isDown and highVolume ? bearishColor : na)
Açık kaynak kodlu komut dosyası
Gerçek TradingView ruhuyla, bu komut dosyasının mimarı, yatırımcıların işlevselliğini inceleyip doğrulayabilmesi için onu açık kaynaklı hale getirdi. Yazarı tebrik ederiz! Ücretsiz olarak kullanabilseniz de, kodu yeniden yayınlamanın Topluluk Kurallarımıza tabi olduğunu unutmayın.
Feragatname
Bilgiler ve yayınlar, TradingView tarafından sağlanan veya onaylanan finansal, yatırım, alım satım veya diğer türden tavsiye veya öneriler anlamına gelmez ve teşkil etmez. Kullanım Koşulları bölümünde daha fazlasını okuyun.