OPEN-SOURCE SCRIPT
Güncellendi (mab) ATR Band
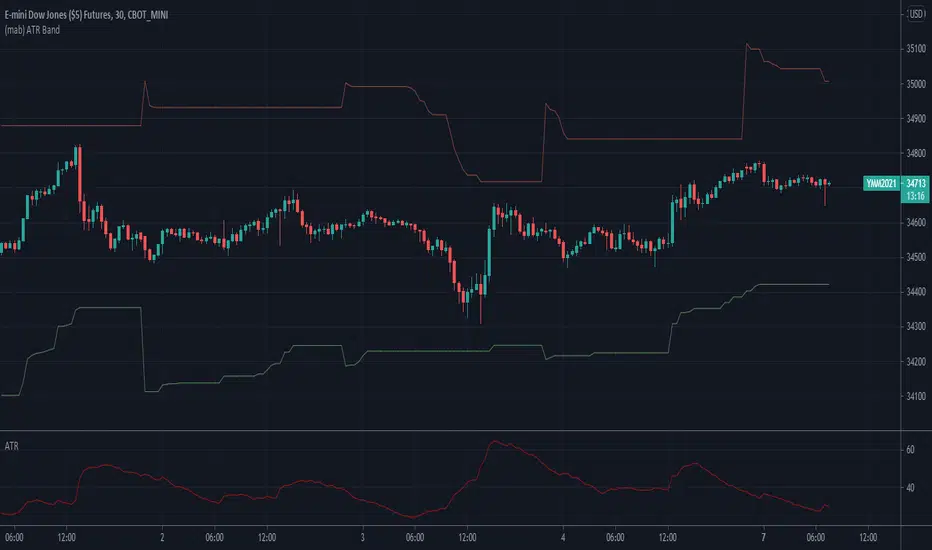
Simple ATR band as overlay on price chart.
Sürüm Notları
This updated version is more advanced. It plots a simple ATR band on daily and higher time frames. On intraday charts it can plot a dynamic band that takes the previous days ATR as starting point. At new lows it lowers the upper band to the new low plus the previous days ATR. At new highs it rises the lower band to the new high minus the previous days ATR.Sürüm Notları
This update enhances the (mab) ATR Band indicator with multi time frame capabilities. If "Floating daily ATR on intraday charts" is enabled, it shows the previous days ATR value as a starting point at the start of the session on intraday charts. At new lows it lowers the upper band to the new low plus the previous days ATR. At new highs it rises the lower band to the new high minus the previous days ATR.Similarly if "Floating weekly/monthly ATR on daily/weekly charts" is enabled, it shows the previous weeks ATR as starting point on daily charts and the previous months ATR on weekly charts. At new lows it lowers the upper band to the new low plus the previous weeks/moths ATR. At new highs it rises the lower band to the new high minus the previous weeks/months ATR.
Açık kaynak kodlu komut dosyası
Gerçek TradingView ruhuyla, bu komut dosyasının mimarı, yatırımcıların işlevselliğini inceleyip doğrulayabilmesi için onu açık kaynaklı hale getirdi. Yazarı tebrik ederiz! Ücretsiz olarak kullanabilseniz de, kodu yeniden yayınlamanın Topluluk Kurallarımıza tabi olduğunu unutmayın.
Feragatname
Bilgiler ve yayınlar, TradingView tarafından sağlanan veya onaylanan finansal, yatırım, alım satım veya diğer türden tavsiye veya öneriler anlamına gelmez ve teşkil etmez. Kullanım Koşulları bölümünde daha fazlasını okuyun.