OPEN-SOURCE SCRIPT
(MA with colored trend background)
MA with colored trend background is a versatile trend-detection indicator that allows users to choose between three types of moving averages:
EMA (Exponential Moving Average)
KAMA (Kaufman Adaptive Moving Average)
Kijun-sen (from the Ichimoku system)
The indicator automatically detects trend shifts based on candlestick interactions with the selected MA line, and visually reflects the current trend direction using dynamic background coloring. Its goal is to help traders quickly interpret trend strength and direction—without relying on multiple indicators.
How it works
The indicator follows this logic to detect bullish and bearish conditions:
Bullish signal (green trend):
When the candle closes above the selected MA and both the open and close are above the MA, a bullish trend is signaled and the chart background turns green.
Bearish signal (red trend):
When the candle closes below the MA and both the open and close are below it, a bearish trend is triggered and the background turns red.
The background color remains until an opposite signal appears, ensuring a consistent visual representation of the current trend phase.
What it does and why it’s useful
Unlike standard moving average indicators that only plot lines, KINSKI Flexi Trend MA provides:
Flexibility to switch between different MA types (EMA, KAMA, or Kijun), allowing users to adapt it to various market environments.
Visual context via background color that enhances clarity—even when scanning multiple charts or working across timeframes.
KAMA uses fixed internal parameters (fast=2, slow=30) to provide a responsive, noise-filtering MA line.
Kijun-sen is calculated as the midpoint between the highest high and lowest low over a user-defined period, similar to its role in Ichimoku.
This combination of visual clarity and analytical flexibility makes the indicator highly suitable for:
Trend-following strategies
Breakout confirmation
Scalping (on lower timeframes)
Swing trading
How to use it
Select the MA type from the dropdown:
EMA (standard exponential moving average)
KAMA (adaptive smoothing)
Kijun-sen (Ichimoku mid-line)
Adjust the MA length depending on your trading style or timeframe:
e.g., EMA 50 for medium-term trend, Kijun 9 for faster signals.
Observe the background color:
Green → bullish trend in progress.
Red → bearish trend in progress.
Background color change may serve as an entry or exit confirmation.
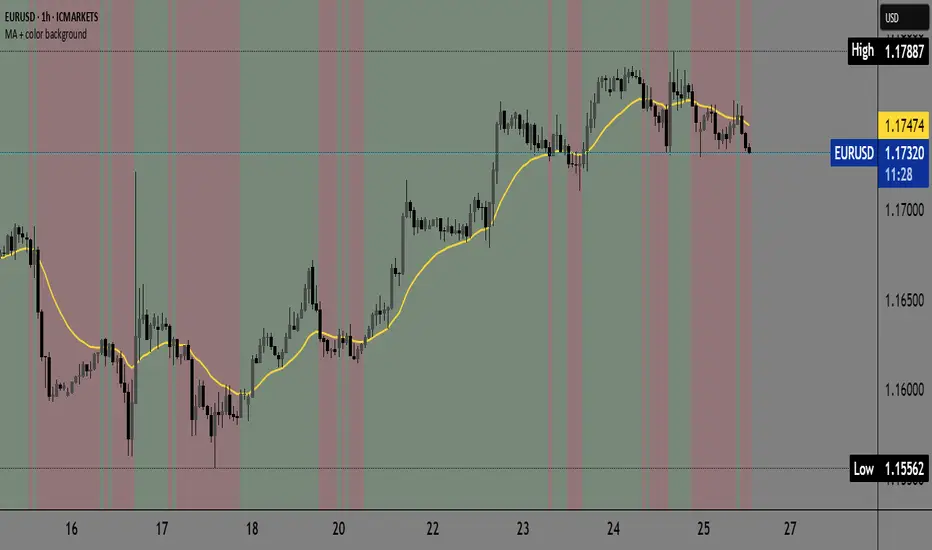
Additional explanation for tracking this indicator:
When we're in a bullish trend, the background is green. We can see a narrow red background appearing when there is a certain pullback. The narrow sections of the colored background indicate that a pullback is active, and we can expect a return to the bullish side. We then return to the green zone. This is also a good indicator during consolidations because it visually shows us that the color changes in the background, as well as their same width, are consistent. This indicates that we should avoid trading during this period.
EMA (Exponential Moving Average)
KAMA (Kaufman Adaptive Moving Average)
Kijun-sen (from the Ichimoku system)
The indicator automatically detects trend shifts based on candlestick interactions with the selected MA line, and visually reflects the current trend direction using dynamic background coloring. Its goal is to help traders quickly interpret trend strength and direction—without relying on multiple indicators.
How it works
The indicator follows this logic to detect bullish and bearish conditions:
Bullish signal (green trend):
When the candle closes above the selected MA and both the open and close are above the MA, a bullish trend is signaled and the chart background turns green.
Bearish signal (red trend):
When the candle closes below the MA and both the open and close are below it, a bearish trend is triggered and the background turns red.
The background color remains until an opposite signal appears, ensuring a consistent visual representation of the current trend phase.
What it does and why it’s useful
Unlike standard moving average indicators that only plot lines, KINSKI Flexi Trend MA provides:
Flexibility to switch between different MA types (EMA, KAMA, or Kijun), allowing users to adapt it to various market environments.
Visual context via background color that enhances clarity—even when scanning multiple charts or working across timeframes.
KAMA uses fixed internal parameters (fast=2, slow=30) to provide a responsive, noise-filtering MA line.
Kijun-sen is calculated as the midpoint between the highest high and lowest low over a user-defined period, similar to its role in Ichimoku.
This combination of visual clarity and analytical flexibility makes the indicator highly suitable for:
Trend-following strategies
Breakout confirmation
Scalping (on lower timeframes)
Swing trading
How to use it
Select the MA type from the dropdown:
EMA (standard exponential moving average)
KAMA (adaptive smoothing)
Kijun-sen (Ichimoku mid-line)
Adjust the MA length depending on your trading style or timeframe:
e.g., EMA 50 for medium-term trend, Kijun 9 for faster signals.
Observe the background color:
Green → bullish trend in progress.
Red → bearish trend in progress.
Background color change may serve as an entry or exit confirmation.
Additional explanation for tracking this indicator:
When we're in a bullish trend, the background is green. We can see a narrow red background appearing when there is a certain pullback. The narrow sections of the colored background indicate that a pullback is active, and we can expect a return to the bullish side. We then return to the green zone. This is also a good indicator during consolidations because it visually shows us that the color changes in the background, as well as their same width, are consistent. This indicates that we should avoid trading during this period.
Açık kaynak kodlu komut dosyası
Gerçek TradingView ruhuna uygun olarak, bu komut dosyasının oluşturucusu bunu açık kaynaklı hale getirmiştir, böylece yatırımcılar betiğin işlevselliğini inceleyip doğrulayabilir. Yazara saygı! Ücretsiz olarak kullanabilirsiniz, ancak kodu yeniden yayınlamanın Site Kurallarımıza tabi olduğunu unutmayın.
Feragatname
Bilgiler ve yayınlar, TradingView tarafından sağlanan veya onaylanan finansal, yatırım, işlem veya diğer türden tavsiye veya tavsiyeler anlamına gelmez ve teşkil etmez. Kullanım Şartları'nda daha fazlasını okuyun.