OPEN-SOURCE SCRIPT
Triple RSI Multi-Timeframe
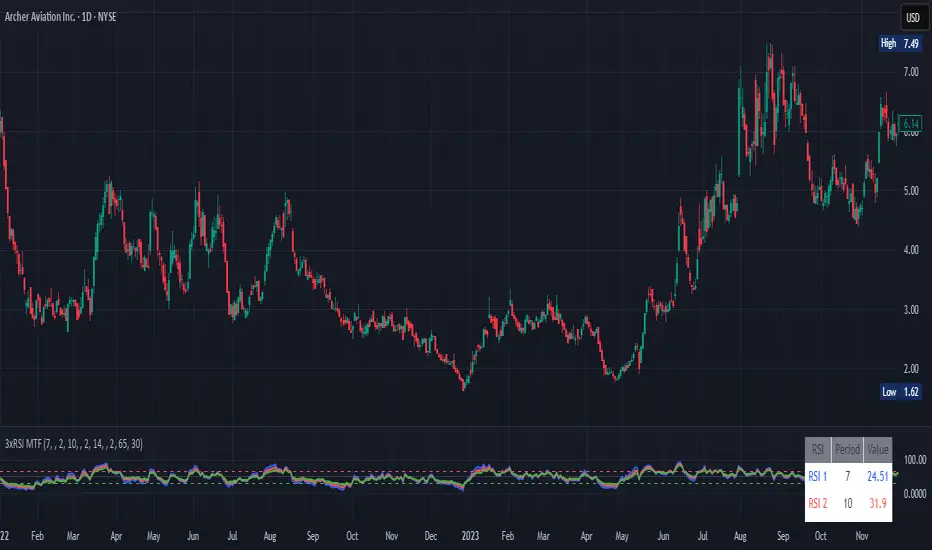
This indicator shows three RSI lines together so you can read market momentum on multiple timeframes at once. Each RSI has its own period, timeframe, and color, so you can quickly tell which line is fast, medium, or slow.
What it helps with
Spot overbought and oversold zones using the 70 and 30 levels, plus an optional midline at 50 for trend bias.
Align signals across timeframes: when two or three RSIs agree, the move is usually stronger.
Time entries and exits: use the shorter‑timeframe RSI for precise timing and the higher‑timeframe RSI for direction.
How to use
Choose the period and timeframe for RSI 1, 2, and 3 based on your style (e.g., 14 on current TF, 21 on 5m, 50 on 15m).
Pick distinct colors so you can recognize each line easily.
Turn on alerts to get notified when any RSI crosses into overbought or oversold.
Açık kaynak kodlu komut dosyası
Gerçek TradingView ruhuna uygun olarak, bu komut dosyasının oluşturucusu bunu açık kaynaklı hale getirmiştir, böylece yatırımcılar betiğin işlevselliğini inceleyip doğrulayabilir. Yazara saygı! Ücretsiz olarak kullanabilirsiniz, ancak kodu yeniden yayınlamanın Site Kurallarımıza tabi olduğunu unutmayın.
Feragatname
Bilgiler ve yayınlar, TradingView tarafından sağlanan veya onaylanan finansal, yatırım, işlem veya diğer türden tavsiye veya tavsiyeler anlamına gelmez ve teşkil etmez. Kullanım Şartları'nda daha fazlasını okuyun.