PROTECTED SOURCE SCRIPT
GoldenJet - First Candle High/Low
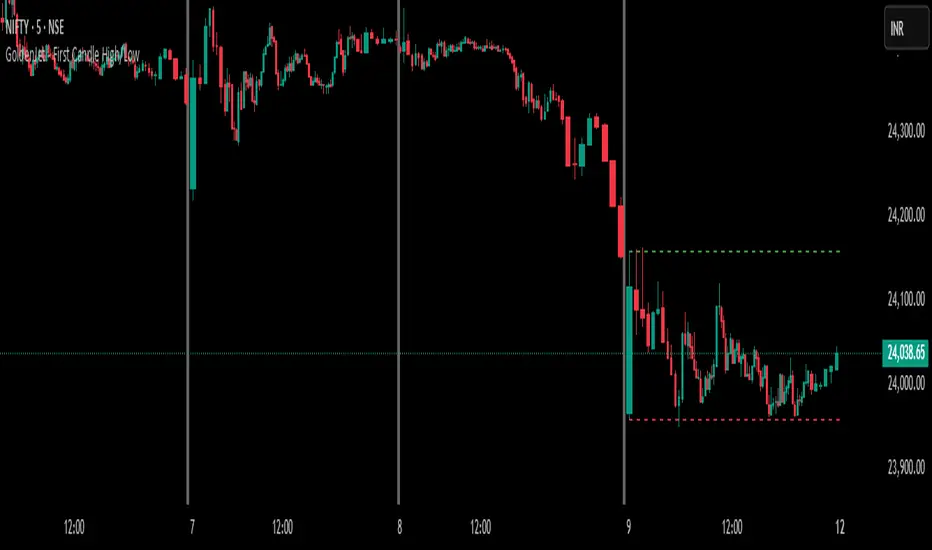
The "First Candle High/Low" indicator is a custom intraday trading tool designed for use on intraday charts (e.g., 1-minute, 5-minute, 15-minute). It automatically marks the high and low of the first completed candle of the trading day using horizontal dashed lines. These lines are extended visually across the chart until the end of the day, allowing traders to reference them easily throughout the session.
The first candle of the day is identified by detecting a new calendar day.
The high and low from that candle are stored and used as key levels.
The levels are displayed as horizontal lines from the first candle's time up to day end
✅ Benefits of This Indicator for Intraday Traders
Establishes Key Reference Points Early:
The high and low of the first candle often act as early indicators of intraday support and resistance.
Helps identify the day's potential range and momentum.
Improves Trade Planning:
You can use the levels to set breakout or reversal entries.
Helps in defining stop-loss and take-profit zones based on these levels.
Supports Multiple Strategies:
Useful in breakout trading, where a break above the first candle high might indicate bullish momentum.
Helpful in mean-reversion or range trading, where price bouncing between high and low can be exploited.
Enhances Risk Management:
By marking predefined levels, you avoid emotionally-driven entries.
Lines provide a clear visual cue for when to act or wait.
Works Across Markets and Instruments:
Applicable to stocks, indices, futures, forex, and crypto — anywhere intraday price action matters.
Korumalı komut dosyası
Bu komut dosyası kapalı kaynak olarak yayınlanmaktadır. Ancak, ücretsiz ve herhangi bir sınırlama olmaksızın kullanabilirsiniz – daha fazla bilgiyi buradan edinebilirsiniz.
Feragatname
Bilgiler ve yayınlar, TradingView tarafından sağlanan veya onaylanan finansal, yatırım, alım satım veya diğer türden tavsiye veya öneriler anlamına gelmez ve teşkil etmez. Kullanım Koşulları bölümünde daha fazlasını okuyun.