OPEN-SOURCE SCRIPT
Güncellendi MA Availability ETA (SMA100/EMA200)
This tool helps traders understand when long-term moving averages become available on any chosen timeframe.
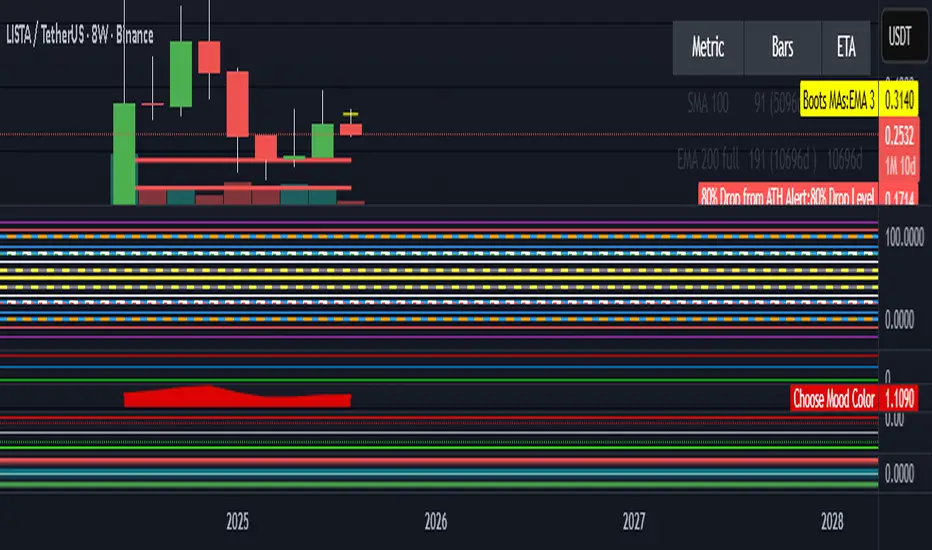
Many new symbols, pairs, or timeframes don’t have enough price history to immediately plot long moving averages like SMA(100) and EMA(200). This script calculates and displays:
✅ Bars Remaining – how many bars are still needed before each moving average can be plotted reliably.
✅ ETA Duration – an estimate of how long (in chart time units) it will take until each MA is available.
✅ Status Table & Label – compact visual summary on the chart and in a table at the top-right corner.
✅ Vertical Marker – a dotted line showing exactly where both SMA(100) & EMA(200) first appear together.
✅ Alerts – optional alerts notify you the moment SMA(100) or EMA(200) become available.
🔑 Features
Works on any timeframe and instrument.
Highlights SMA(100) and EMA(200) on the chart for reference.
Lets you choose whether EMA(200) should be considered ready immediately, or only after a full 200-bar history.
Useful for traders who rely on long-term MA signals (golden cross, dynamic support/resistance, trend confirmation) and want to know when these tools will be ready on fresh charts.
🎯 Use Cases
New listings / low-history assets → See when SMA100 & EMA200 become usable.
Backtesting or forward-testing → Anticipate when long-term signals will first appear.
Trend-following strategies → Prepare in advance for crossovers or key support/resistance confluence zones.
⚠️ Note: ETAs are based on chart resolution and assume continuous data; real-world session gaps, weekends, or illiquid trading can make availability slightly later.
👉 Add this to your chart and you’ll always know when the big moving averages arrive — a critical moment for many upside moves and long-term strategies.
Sürüm Notları
updated visibility so it is cleanerAçık kaynak kodlu komut dosyası
Gerçek TradingView ruhuyla, bu komut dosyasının yaratıcısı, yatırımcıların işlevselliğini inceleyip doğrulayabilmesi için onu açık kaynaklı hale getirdi. Yazarı tebrik ederiz! Ücretsiz olarak kullanabilseniz de, kodu yeniden yayınlamanın Topluluk Kurallarımıza tabi olduğunu unutmayın.
Feragatname
Bilgiler ve yayınlar, TradingView tarafından sağlanan veya onaylanan finansal, yatırım, alım satım veya diğer türden tavsiye veya öneriler anlamına gelmez ve teşkil etmez. Kullanım Koşulları bölümünde daha fazlasını okuyun.
Açık kaynak kodlu komut dosyası
Gerçek TradingView ruhuyla, bu komut dosyasının yaratıcısı, yatırımcıların işlevselliğini inceleyip doğrulayabilmesi için onu açık kaynaklı hale getirdi. Yazarı tebrik ederiz! Ücretsiz olarak kullanabilseniz de, kodu yeniden yayınlamanın Topluluk Kurallarımıza tabi olduğunu unutmayın.
Feragatname
Bilgiler ve yayınlar, TradingView tarafından sağlanan veya onaylanan finansal, yatırım, alım satım veya diğer türden tavsiye veya öneriler anlamına gelmez ve teşkil etmez. Kullanım Koşulları bölümünde daha fazlasını okuyun.