OPEN-SOURCE SCRIPT
Indicator: Forecast Oscillator & a BB extrapolation experiment
FOSC (Forecast Oscillator, %F) is implemented as explained by Kaufman (there are lot of representations out there, using linregs, this one is not.).
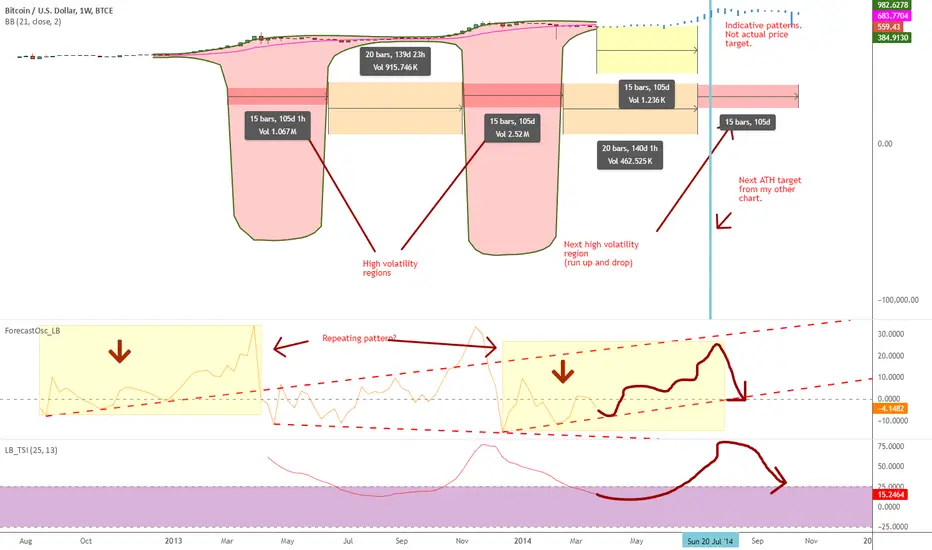
This indicator plots a 3-period smoothing of %F. When %F = 0, the trend line and prices are moving parallel to one another; when %F is above 0 the market is accelerating away from the trend line; when %F is below 0 prices are slowing down and the two series are converging.
Now on to the BB extrapolation: As you can see above, a 21-period BB on 1W shows 2 volatile areas of same length. Simple projection using the same time periods gives us a similar volatile area in another 105d. FOSC is forming a similar pattern now as of the first area. More information in the chart markings.
Interesting thing for me was how my other chart (tradingview.com/v/HeSyTev8/) aligned with this. Lets see how far these timelines are respected.
In the mean time, feel free to "Make mine" this and use FOSC in your charts. Appreciate any feedback / comments.
Açık kaynak kodlu komut dosyası
Gerçek TradingView ruhuyla, bu komut dosyasının mimarı, yatırımcıların işlevselliğini inceleyip doğrulayabilmesi için onu açık kaynaklı hale getirdi. Yazarı tebrik ederiz! Ücretsiz olarak kullanabilseniz de, kodu yeniden yayınlamanın Topluluk Kurallarımıza tabi olduğunu unutmayın.
List of my free indicators: bit.ly/1LQaPK8
List of my indicators at Appstore: blog.tradingview.com/?p=970
List of my indicators at Appstore: blog.tradingview.com/?p=970
Feragatname
Bilgiler ve yayınlar, TradingView tarafından sağlanan veya onaylanan finansal, yatırım, alım satım veya diğer türden tavsiye veya öneriler anlamına gelmez ve teşkil etmez. Kullanım Koşulları bölümünde daha fazlasını okuyun.