PROTECTED SOURCE SCRIPT
HPT - Heikin-Ashi Price Tool
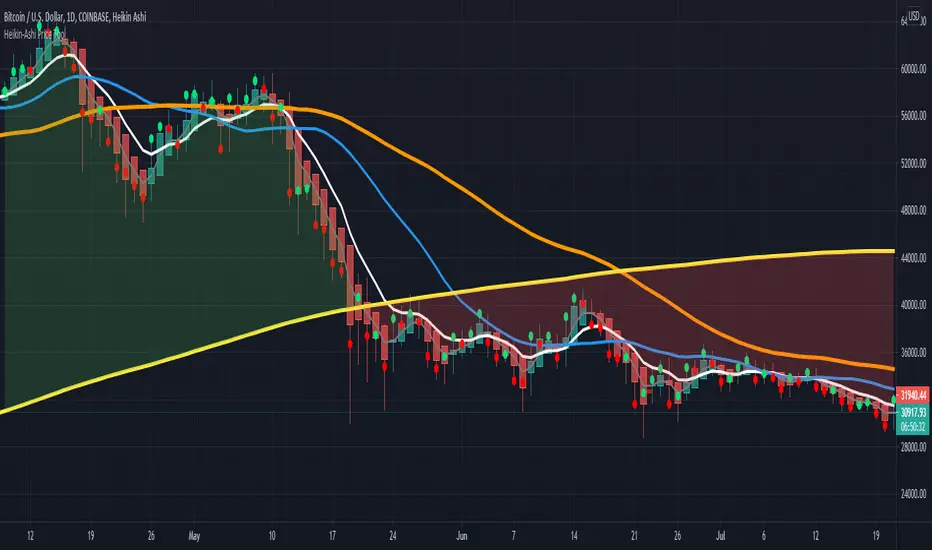
This overlay study can be used with an Heikin-Ashi chart and diplays the real prices for Heikin-Ashi candles as circles for each bar. If the real closing price of the bar is higher then the opening price, the circle has a green color, otherwise it is red.
Here you can see the overlay : BTCUSD
The follwing moving averages are added to the chart as well: SMA 20, 50, 200 and EMA 8 (for analyzing trend and support/resistance ). A background fill can be activated for the overall trend.
I recommend to lower the opacity for the bars so that you can better see the circles for the real prices.
Here you can see the overlay :
The follwing moving averages are added to the chart as well: SMA 20, 50, 200 and EMA 8 (for analyzing trend and support/resistance ). A background fill can be activated for the overall trend.
I recommend to lower the opacity for the bars so that you can better see the circles for the real prices.
Korumalı komut dosyası
Bu komut dosyası kapalı kaynak olarak yayınlanmaktadır. Ancak, ücretsiz ve herhangi bir sınırlama olmaksızın kullanabilirsiniz – daha fazla bilgiyi buradan edinebilirsiniz.
Access our indicators from: indivisionx.com
Feragatname
Bilgiler ve yayınlar, TradingView tarafından sağlanan veya onaylanan finansal, yatırım, alım satım veya diğer türden tavsiye veya öneriler anlamına gelmez ve teşkil etmez. Kullanım Koşulları bölümünde daha fazlasını okuyun.