PROTECTED SOURCE SCRIPT
Güncellendi Multi-Timeframe MA Breakout/Breakdown Analysis
📊 Overview
This sophisticated Pine Script indicator revolutionizes breakout/breakdown analysis by distinguishing between fake and genuine signals using a unique swing-level validation methodology. Unlike traditional moving average crossovers, this system validates price movements against historical swing points, providing traders with high-probability entry and exit signals across multiple timeframes.
🎯 Core Trading Methodology
The Swing Validation Concept:
Traditional MA breakouts often fail because they don't consider the context of previous price action. This indicator solves this by:
Recording swing levels when each MA is initially crossed
Validating subsequent crosses against these historical swing points
Classifying signals as fake or genuine based on this validation
Tracking signal evolution as price action develops
Signal Classification System:
🔻 Breakdown Analysis:
Fake Breakdown: Price cuts below MA but stays above the swing low from previous MA cut
Genuine Breakdown: Price cuts below MA and falls below the swing low from previous MA cut
Validation Chain: EMA 50 validates against EMA 20 swing low, EMA 100 against EMA 50 swing low, EMA 200 against EMA 100 swing low
🔺 Breakout Analysis:
Fake Breakout: Price crosses above MA but stays below the swing high from previous MA cross
Genuine Breakout: Price crosses above MA and exceeds the swing high from previous MA cross
Validation Chain: EMA 50 validates against EMA 20 swing high, EMA 100 against EMA 50 swing high, EMA 200 against EMA 100 swing high
📈 Signal Interpretation Guide
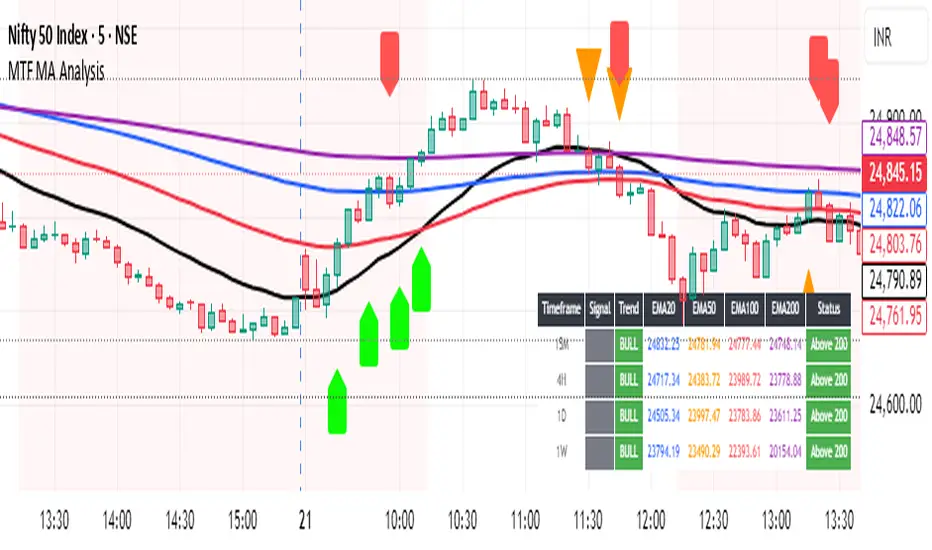
Visual Chart Signals:
Breakdown Signals:
🔻 Orange Triangle Down + "FAKE BREAKDOWN": Potential reversal opportunity - price likely to bounce
🔻 Red Triangle Down + "GENUINE BREAKDOWN": Trend continuation - expect further downside
🔺 Lime Triangle Up + "BULLISH REVERSAL": Strong buy signal after fake breakdown validation
Breakout Signals:
🔺 Orange Triangle Up + "FAKE BREAKOUT": Potential reversal opportunity - price likely to decline
🔺 Dark Red Triangle Up + "GENUINE BREAKOUT": Trend continuation - expect further upside
🔻 Fuchsia Triangle Down + "BEARISH REVERSAL": Strong sell signal after fake breakout validation
Multi-Timeframe Analysis Table:
Signal Column Interpretation:
"FAKE BD" (Orange): Fake breakdown detected - watch for bullish reversal
"GENUINE BD" (Red): Genuine breakdown - bearish continuation likely
"FAKE BO" (Orange): Fake breakout detected - watch for bearish reversal
"GENUINE BO" (Dark Red): Genuine breakout - bullish continuation likely
"BULLISH" (Lime): Bullish reversal confirmed - strong buy signal
"BEARISH" (Fuchsia): Bearish reversal confirmed - strong sell signal
Trend Column:
"BULL" (Green): EMAs in bullish sequence (20>50>100>200)
"BEAR" (Red): EMAs in bearish sequence (20<50<100<200)
"SIDE" (Gray): Sideways/mixed EMA alignment
Status Column:
"Above 200" (Green): Price above 200 EMA - bullish bias
"Below 200" (Red): Price below 200 EMA - bearish bias
"At 200" (Gray): Price at 200 EMA - neutral
💡 Trading Strategies
Strategy 1: Fake Signal Reversal Trading
For Long Entries (Fake Breakdown Reversal):
Wait for fake breakdown signal (orange triangle down)
Confirm bullish reversal (lime triangle up) when price reclaims EMAs
Enter long on bullish reversal confirmation
Stop loss below the swing low that validated the fake breakdown
Target next resistance level or previous swing high
For Short Entries (Fake Breakout Reversal):
Wait for fake breakout signal (orange triangle up)
Confirm bearish reversal (fuchsia triangle down) when price falls below EMAs
Enter short on bearish reversal confirmation
Stop loss above the swing high that validated the fake breakout
Target next support level or previous swing low
Strategy 2: Genuine Signal Trend Following
For Trend Continuation Longs:
Identify genuine breakout (dark red triangle up)
Confirm higher timeframe alignment (4H/1D showing bullish trend)
Enter on pullback to broken resistance (now support)
Stop loss below the validation swing high
Target measured move or next major resistance
For Trend Continuation Shorts:
Identify genuine breakdown (red triangle down)
Confirm higher timeframe alignment (4H/1D showing bearish trend)
Enter on pullback to broken support (now resistance)
Stop loss above the validation swing low
Target measured move or next major support
Strategy 3: Multi-Timeframe Confluence
High-Probability Setups:
Align signals across timeframes (15M signal + 4H trend confirmation)
Look for confluence (multiple timeframes showing same signal type)
Prioritize higher timeframe signals for swing/position trades
Use lower timeframes for precise entry timing
⚠️ Risk Management Rules
Position Sizing:
Fake signal trades: Reduce position size (higher risk, higher reward)
Genuine signal trades: Standard position size (trend following)
Multi-timeframe confluence: Increase position size (higher probability)
Stop Loss Guidelines:
Fake breakdown longs: Stop below validation swing low
Fake breakout shorts: Stop above validation swing high
Genuine signals: Stop beyond the MA that was broken
Reversals: Stop beyond the reversal invalidation level
Take Profit Strategies:
Scale out at key resistance/support levels
Trail stops using the 20 EMA for trend following
Take partial profits at 1:2 risk/reward ratio
Let winners run on strong trend continuation signals
🔧 Best Practices
Signal Validation:
Wait for candle close before acting on signals
Check volume confirmation on breakouts/breakdowns
Consider market context (news, earnings, etc.)
Avoid trading during low liquidity periods
Timeframe Selection:
Scalping: 15M signals with 4H trend filter
Day Trading: 4H signals with 1D trend filter
Swing Trading: 1D signals with 1W trend filter
Position Trading: 1W signals for major moves
Market Conditions:
Trending Markets: Focus on genuine signals for continuation
Range-Bound Markets: Focus on fake signals for reversals
High Volatility: Reduce position sizes and widen stops
Low Volatility: Look for breakout setups with volume
📋 Advanced Tips
Signal Evolution Monitoring:
Watch for signal transitions (fake becoming genuine or vice versa)
Adjust positions when signal classification changes
Use alerts to stay informed of signal updates
Monitor multiple timeframes for comprehensive analysis
Confluence Factors:
Support/Resistance levels at signal points
Volume spikes on genuine signals
RSI divergences with fake signals
Fibonacci retracements at reversal points
Common Pitfalls to Avoid:
Don't chase signals after significant moves
Don't ignore higher timeframe trends
Don't overtrade on every signal
Don't neglect risk management rules
🎯 Quick Reference
Bullish Signals Priority:
Bullish Reversal (Lime) - Highest priority
Fake Breakdown (Orange) - High probability reversal
Genuine Breakout (Dark Red) - Trend continuation
Bearish Signals Priority:
Bearish Reversal (Fuchsia) - Highest priority
Fake Breakout (Orange) - High probability reversal
Genuine Breakdown (Red) - Trend continuation
Multi-Timeframe Hierarchy:
1W: Major trend direction
1D: Intermediate trend and swing levels
4H: Short-term trend and entry timing
15M: Precise entry and exit points
⚡ Pro Tip: The most powerful signals occur when fake signals reverse into genuine signals in the opposite direction, creating high-momentum moves with excellent risk/reward ratios.
Disclaimer: This indicator is for educational purposes. Always combine with proper risk management, additional technical analysis, and fundamental research before making trading decisions. Past performance does not guarantee future results.
This sophisticated Pine Script indicator revolutionizes breakout/breakdown analysis by distinguishing between fake and genuine signals using a unique swing-level validation methodology. Unlike traditional moving average crossovers, this system validates price movements against historical swing points, providing traders with high-probability entry and exit signals across multiple timeframes.
🎯 Core Trading Methodology
The Swing Validation Concept:
Traditional MA breakouts often fail because they don't consider the context of previous price action. This indicator solves this by:
Recording swing levels when each MA is initially crossed
Validating subsequent crosses against these historical swing points
Classifying signals as fake or genuine based on this validation
Tracking signal evolution as price action develops
Signal Classification System:
🔻 Breakdown Analysis:
Fake Breakdown: Price cuts below MA but stays above the swing low from previous MA cut
Genuine Breakdown: Price cuts below MA and falls below the swing low from previous MA cut
Validation Chain: EMA 50 validates against EMA 20 swing low, EMA 100 against EMA 50 swing low, EMA 200 against EMA 100 swing low
🔺 Breakout Analysis:
Fake Breakout: Price crosses above MA but stays below the swing high from previous MA cross
Genuine Breakout: Price crosses above MA and exceeds the swing high from previous MA cross
Validation Chain: EMA 50 validates against EMA 20 swing high, EMA 100 against EMA 50 swing high, EMA 200 against EMA 100 swing high
📈 Signal Interpretation Guide
Visual Chart Signals:
Breakdown Signals:
🔻 Orange Triangle Down + "FAKE BREAKDOWN": Potential reversal opportunity - price likely to bounce
🔻 Red Triangle Down + "GENUINE BREAKDOWN": Trend continuation - expect further downside
🔺 Lime Triangle Up + "BULLISH REVERSAL": Strong buy signal after fake breakdown validation
Breakout Signals:
🔺 Orange Triangle Up + "FAKE BREAKOUT": Potential reversal opportunity - price likely to decline
🔺 Dark Red Triangle Up + "GENUINE BREAKOUT": Trend continuation - expect further upside
🔻 Fuchsia Triangle Down + "BEARISH REVERSAL": Strong sell signal after fake breakout validation
Multi-Timeframe Analysis Table:
Signal Column Interpretation:
"FAKE BD" (Orange): Fake breakdown detected - watch for bullish reversal
"GENUINE BD" (Red): Genuine breakdown - bearish continuation likely
"FAKE BO" (Orange): Fake breakout detected - watch for bearish reversal
"GENUINE BO" (Dark Red): Genuine breakout - bullish continuation likely
"BULLISH" (Lime): Bullish reversal confirmed - strong buy signal
"BEARISH" (Fuchsia): Bearish reversal confirmed - strong sell signal
Trend Column:
"BULL" (Green): EMAs in bullish sequence (20>50>100>200)
"BEAR" (Red): EMAs in bearish sequence (20<50<100<200)
"SIDE" (Gray): Sideways/mixed EMA alignment
Status Column:
"Above 200" (Green): Price above 200 EMA - bullish bias
"Below 200" (Red): Price below 200 EMA - bearish bias
"At 200" (Gray): Price at 200 EMA - neutral
💡 Trading Strategies
Strategy 1: Fake Signal Reversal Trading
For Long Entries (Fake Breakdown Reversal):
Wait for fake breakdown signal (orange triangle down)
Confirm bullish reversal (lime triangle up) when price reclaims EMAs
Enter long on bullish reversal confirmation
Stop loss below the swing low that validated the fake breakdown
Target next resistance level or previous swing high
For Short Entries (Fake Breakout Reversal):
Wait for fake breakout signal (orange triangle up)
Confirm bearish reversal (fuchsia triangle down) when price falls below EMAs
Enter short on bearish reversal confirmation
Stop loss above the swing high that validated the fake breakout
Target next support level or previous swing low
Strategy 2: Genuine Signal Trend Following
For Trend Continuation Longs:
Identify genuine breakout (dark red triangle up)
Confirm higher timeframe alignment (4H/1D showing bullish trend)
Enter on pullback to broken resistance (now support)
Stop loss below the validation swing high
Target measured move or next major resistance
For Trend Continuation Shorts:
Identify genuine breakdown (red triangle down)
Confirm higher timeframe alignment (4H/1D showing bearish trend)
Enter on pullback to broken support (now resistance)
Stop loss above the validation swing low
Target measured move or next major support
Strategy 3: Multi-Timeframe Confluence
High-Probability Setups:
Align signals across timeframes (15M signal + 4H trend confirmation)
Look for confluence (multiple timeframes showing same signal type)
Prioritize higher timeframe signals for swing/position trades
Use lower timeframes for precise entry timing
⚠️ Risk Management Rules
Position Sizing:
Fake signal trades: Reduce position size (higher risk, higher reward)
Genuine signal trades: Standard position size (trend following)
Multi-timeframe confluence: Increase position size (higher probability)
Stop Loss Guidelines:
Fake breakdown longs: Stop below validation swing low
Fake breakout shorts: Stop above validation swing high
Genuine signals: Stop beyond the MA that was broken
Reversals: Stop beyond the reversal invalidation level
Take Profit Strategies:
Scale out at key resistance/support levels
Trail stops using the 20 EMA for trend following
Take partial profits at 1:2 risk/reward ratio
Let winners run on strong trend continuation signals
🔧 Best Practices
Signal Validation:
Wait for candle close before acting on signals
Check volume confirmation on breakouts/breakdowns
Consider market context (news, earnings, etc.)
Avoid trading during low liquidity periods
Timeframe Selection:
Scalping: 15M signals with 4H trend filter
Day Trading: 4H signals with 1D trend filter
Swing Trading: 1D signals with 1W trend filter
Position Trading: 1W signals for major moves
Market Conditions:
Trending Markets: Focus on genuine signals for continuation
Range-Bound Markets: Focus on fake signals for reversals
High Volatility: Reduce position sizes and widen stops
Low Volatility: Look for breakout setups with volume
📋 Advanced Tips
Signal Evolution Monitoring:
Watch for signal transitions (fake becoming genuine or vice versa)
Adjust positions when signal classification changes
Use alerts to stay informed of signal updates
Monitor multiple timeframes for comprehensive analysis
Confluence Factors:
Support/Resistance levels at signal points
Volume spikes on genuine signals
RSI divergences with fake signals
Fibonacci retracements at reversal points
Common Pitfalls to Avoid:
Don't chase signals after significant moves
Don't ignore higher timeframe trends
Don't overtrade on every signal
Don't neglect risk management rules
🎯 Quick Reference
Bullish Signals Priority:
Bullish Reversal (Lime) - Highest priority
Fake Breakdown (Orange) - High probability reversal
Genuine Breakout (Dark Red) - Trend continuation
Bearish Signals Priority:
Bearish Reversal (Fuchsia) - Highest priority
Fake Breakout (Orange) - High probability reversal
Genuine Breakdown (Red) - Trend continuation
Multi-Timeframe Hierarchy:
1W: Major trend direction
1D: Intermediate trend and swing levels
4H: Short-term trend and entry timing
15M: Precise entry and exit points
⚡ Pro Tip: The most powerful signals occur when fake signals reverse into genuine signals in the opposite direction, creating high-momentum moves with excellent risk/reward ratios.
Disclaimer: This indicator is for educational purposes. Always combine with proper risk management, additional technical analysis, and fundamental research before making trading decisions. Past performance does not guarantee future results.
Sürüm Notları
Updated plotting stylesKorumalı komut dosyası
Bu komut dosyası kapalı kaynak olarak yayınlanmaktadır. Ancak, ücretsiz ve herhangi bir sınırlama olmaksızın kullanabilirsiniz – daha fazla bilgiyi buradan edinebilirsiniz.
Feragatname
Bilgiler ve yayınlar, TradingView tarafından sağlanan veya onaylanan finansal, yatırım, alım satım veya diğer türden tavsiye veya öneriler anlamına gelmez ve teşkil etmez. Kullanım Koşulları bölümünde daha fazlasını okuyun.
Korumalı komut dosyası
Bu komut dosyası kapalı kaynak olarak yayınlanmaktadır. Ancak, ücretsiz ve herhangi bir sınırlama olmaksızın kullanabilirsiniz – daha fazla bilgiyi buradan edinebilirsiniz.
Feragatname
Bilgiler ve yayınlar, TradingView tarafından sağlanan veya onaylanan finansal, yatırım, alım satım veya diğer türden tavsiye veya öneriler anlamına gelmez ve teşkil etmez. Kullanım Koşulları bölümünde daha fazlasını okuyun.