OPEN-SOURCE SCRIPT
MPI Burst Regime by CoryP1990 – Quant Toolkit
The Microstructure Pressure Index (MPI) Burst Regime indicator detects rare, clustered volume bursts (Percentile + Z-score), converts them into an MPI (% of bursts over a rolling window), then signals and shades short-term up-pressure regimes only when structural filters (VWMA slope, Close > VWMA / Bollinger Upper) align. Includes Anchored VWAP end-detector to spot regime neutralization.
Microstructure Pressure Index (MPI) — Burst → Cluster → Regime
Why this is different
Most volume tools flag single high-volume bars. MPI requires repeated bursts within a cluster window and then promotes them into a persistent regime (MPI%). This reduces noise and signals regime or campaign-style pressure rather than one-off spikes.
How it works
Burst gate: bar is a candidate if volume ≥ Xth percentile of recent history and/or Z-score ≥ threshold (user selectable).
Clustering: require ≥ minBursts within a clusWin window to avoid lone spikes.
MPI: percent of burst bars within lenMPI via SMA% or EMA%.
RegimeUp: MPI ≥ mpiTrig + cluster OK + structural filters (VWMA slope, Close > VW/BB) + optional session filter.
End detector: optional Session/Anchored VWAP + pin/flat/slope/volume collapse + IIP neutralization triggers regime end.
Recommended settings
Start: 5-minute charts.
Auto-tune: ON (recommended) - script adapts windows to timeframe.
If you want more sensitivity: lower mpiTrig or shorten lenMPI.
To be stricter/rarer: raise pctVol and zThr, increase minBursts.
Inputs
Auto-adapt - toggle timeframe auto-tuning.
MPI window, Percentrank lookback, Volume percentile, Z-score lookback, Z threshold, MPI trigger
Bollinger (len, mult), VWMA length
Structural filters: Close>VW, Close>UB, VWMA slope requirement
Clustering: minBursts, clusWin and SMA% / EMA% choice for MPI
Visualization: markers, shading, cooldown, confirm on close
VWAP: Session / Anchored (auto/manual) and end-detector thresholds
Alerts
Use the built-in alerts: MPI Burst Trigger (Up), MPI Regime Active (Up), MPI Regime END (VWAP), Single Burst Bar. The indicator supports “Confirm on close” gating to avoid intrabar noise.
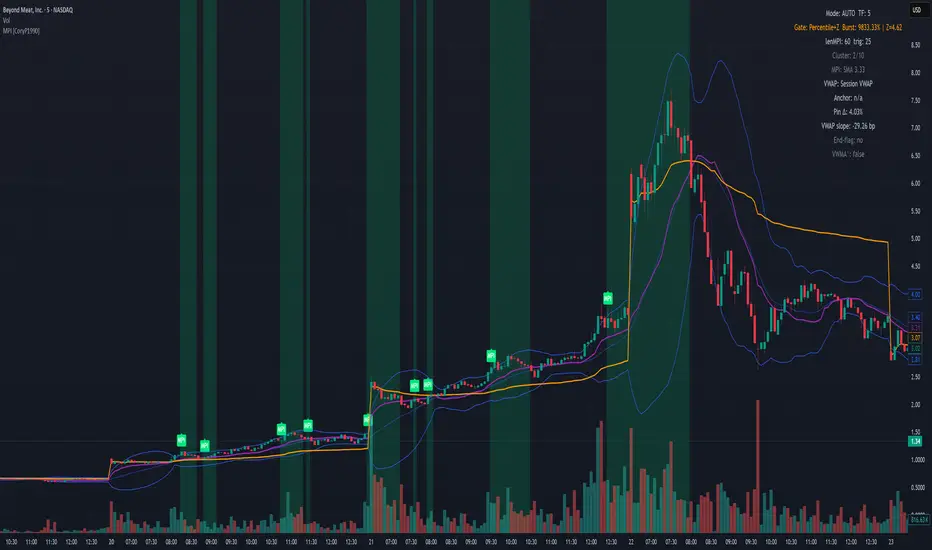
Example - (BYND, 5min)
On BYND, MPI flagged multiple clustered volume bursts hours before the vertical move and maintained a shaded up-regime as price rode the Bollinger upper band and VWMA sloped up. The regime reliably ended as VWMA flattened, volume collapsed and VWAP neutralized.
What you’re looking at (walkthrough):
Pre-run clustering: several green MPI markers appear before the large gap/rally... these are clustered percentile+Z bursts (not one-offs).
Regime persistence: once MPI% crosses the threshold and structural filters (VWMA slope, Close>VWMA) hold, the indicator shades the regime (lime). This shading persisted through the main thrust.
Price structure confirmation: price tracks the BB upper band during the push - classic accumulation → expansion behavior.
Regime END: after the top, VWMA slopes down, volume collapses and VWAP conditions trend toward neutralization - end detector flags the regime end.
Settings used in this demo (recommended start):
Chart: 5-min (demo)
Auto-Tune: ON (recommended)
lenMPI = 60, lenRank = 300, pctVol = 98, zLen = 300, zThr = 1.96, mpiTrig = 25
minBursts = 3, clusWin = 10, mpiMode = SMA%
confirmOnClose = true, session only = true for the screenshot
Why this matters:
Most volume tools flag single prints. MPI requires repeated bursts within a window and converts that density into an MPI% regime. That reduces false positives and surfaces regime or campaign-style pressure you can act upon or study.
Part of the Quant Toolkit — transparent, open-source indicators for modern quantitative analysis. Built by CoryP1990.
Microstructure Pressure Index (MPI) — Burst → Cluster → Regime
Why this is different
Most volume tools flag single high-volume bars. MPI requires repeated bursts within a cluster window and then promotes them into a persistent regime (MPI%). This reduces noise and signals regime or campaign-style pressure rather than one-off spikes.
How it works
Burst gate: bar is a candidate if volume ≥ Xth percentile of recent history and/or Z-score ≥ threshold (user selectable).
Clustering: require ≥ minBursts within a clusWin window to avoid lone spikes.
MPI: percent of burst bars within lenMPI via SMA% or EMA%.
RegimeUp: MPI ≥ mpiTrig + cluster OK + structural filters (VWMA slope, Close > VW/BB) + optional session filter.
End detector: optional Session/Anchored VWAP + pin/flat/slope/volume collapse + IIP neutralization triggers regime end.
Recommended settings
Start: 5-minute charts.
Auto-tune: ON (recommended) - script adapts windows to timeframe.
If you want more sensitivity: lower mpiTrig or shorten lenMPI.
To be stricter/rarer: raise pctVol and zThr, increase minBursts.
Inputs
Auto-adapt - toggle timeframe auto-tuning.
MPI window, Percentrank lookback, Volume percentile, Z-score lookback, Z threshold, MPI trigger
Bollinger (len, mult), VWMA length
Structural filters: Close>VW, Close>UB, VWMA slope requirement
Clustering: minBursts, clusWin and SMA% / EMA% choice for MPI
Visualization: markers, shading, cooldown, confirm on close
VWAP: Session / Anchored (auto/manual) and end-detector thresholds
Alerts
Use the built-in alerts: MPI Burst Trigger (Up), MPI Regime Active (Up), MPI Regime END (VWAP), Single Burst Bar. The indicator supports “Confirm on close” gating to avoid intrabar noise.
Example - (BYND, 5min)
On BYND, MPI flagged multiple clustered volume bursts hours before the vertical move and maintained a shaded up-regime as price rode the Bollinger upper band and VWMA sloped up. The regime reliably ended as VWMA flattened, volume collapsed and VWAP neutralized.
What you’re looking at (walkthrough):
Pre-run clustering: several green MPI markers appear before the large gap/rally... these are clustered percentile+Z bursts (not one-offs).
Regime persistence: once MPI% crosses the threshold and structural filters (VWMA slope, Close>VWMA) hold, the indicator shades the regime (lime). This shading persisted through the main thrust.
Price structure confirmation: price tracks the BB upper band during the push - classic accumulation → expansion behavior.
Regime END: after the top, VWMA slopes down, volume collapses and VWAP conditions trend toward neutralization - end detector flags the regime end.
Settings used in this demo (recommended start):
Chart: 5-min (demo)
Auto-Tune: ON (recommended)
lenMPI = 60, lenRank = 300, pctVol = 98, zLen = 300, zThr = 1.96, mpiTrig = 25
minBursts = 3, clusWin = 10, mpiMode = SMA%
confirmOnClose = true, session only = true for the screenshot
Why this matters:
Most volume tools flag single prints. MPI requires repeated bursts within a window and converts that density into an MPI% regime. That reduces false positives and surfaces regime or campaign-style pressure you can act upon or study.
Part of the Quant Toolkit — transparent, open-source indicators for modern quantitative analysis. Built by CoryP1990.
Açık kaynak kodlu komut dosyası
Gerçek TradingView ruhuna uygun olarak, bu komut dosyasının oluşturucusu bunu açık kaynaklı hale getirmiştir, böylece yatırımcılar betiğin işlevselliğini inceleyip doğrulayabilir. Yazara saygı! Ücretsiz olarak kullanabilirsiniz, ancak kodu yeniden yayınlamanın Site Kurallarımıza tabi olduğunu unutmayın.
Quant finance researcher focused on options, volatility modeling, and derivative pricing. Building tools that turn complex market behavior into clear, data-driven insights. Explore analytics and modeling at OptionsAnalysisSuite.com
Feragatname
Bilgiler ve yayınlar, TradingView tarafından sağlanan veya onaylanan finansal, yatırım, işlem veya diğer türden tavsiye veya tavsiyeler anlamına gelmez ve teşkil etmez. Kullanım Şartları'nda daha fazlasını okuyun.