PROTECTED SOURCE SCRIPT
Paparan MTF Bollinger Bands
Script Description: MTF Bollinger Bands Display
1. Core Purpose
The main purpose of this script is to display two sets of Bollinger Bands (BB) from two different timeframes on a single chart. It is a visual analysis tool designed to help traders see the market from two perspectives simultaneously:
Short-Term Perspective (LTF): Current price action and volatility.
Long-Term Perspective (HTF): The broader trend and significant "value zones."
2. Key Features & Settings
The script is highly flexible, as nearly all elements can be modified through the Settings menu (⚙️ icon). It is divided into two main sections:
Section 1: Current Timeframe (LTF) Settings
BB Length (Length): Determines the period for the moving average (default: 20).
Standard Deviation (StdDev): Sets the width of the Bollinger Bands (default: 2.0).
Color: Allows you to change the color for this BB set (default: Blue).
Section 2: Higher Timeframe (HTF) Settings
Select Higher Timeframe (Timeframe): This is the most important setting. Here you can choose your reference timeframe, for example, "240" (4-Hour), "D" (Daily), or "W" (Weekly).
BB Length & StdDev: Similar to the LTF, you can set the BB parameters for the HTF independently.
Color & Line Thickness: You can change the color (default: Black) and also the line thickness to easily distinguish it from the current timeframe's BB.
3. How It Works
The script performs two parallel calculations:
LTF Calculation: It calculates the Bollinger Bands normally using the price data from the timeframe you are currently viewing on your chart (e.g., 15-Minute). The result is the blue lines that move smoothly with each candle.
HTF Calculation: This is the more complex part.
It uses the request.security() function to "request" the Bollinger Bands data from the higher timeframe (e.g., 4-Hour) that you have set.
To ensure the displayed data is accurate and does not "repaint," it fetches the BB values from the HTF candle that has already closed.
This means that the BB value from a single 4-hour candle will remain constant and be plotted as a flat line across all the 15-minute candles that fall within that 4-hour period.
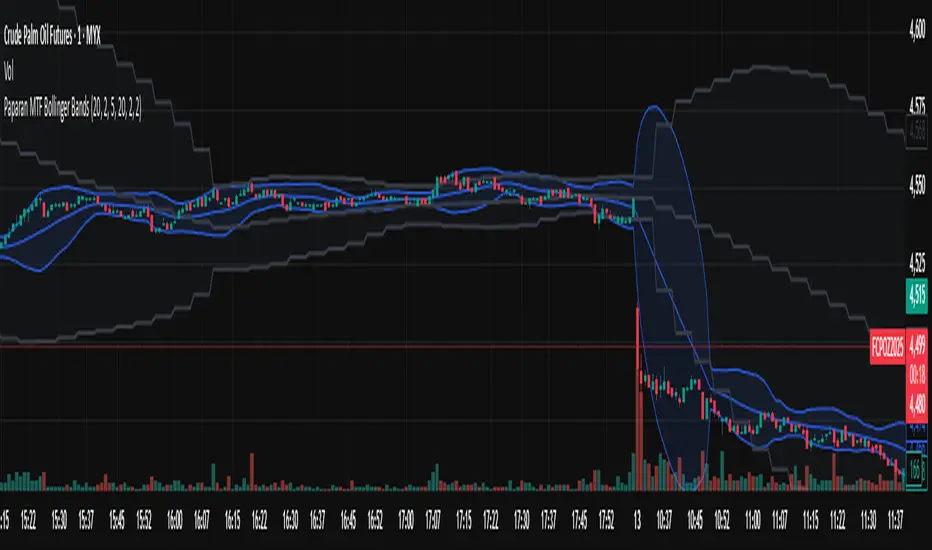
4. What You See on the Chart (Visual Output)
When you add this script to a chart (for example, a 15-minute chart), you will see:
One set of blue Bollinger Bands that closely "hugs" the 15-minute price. This shows the short-term volatility.
Another set of thicker, black Bollinger Bands that appear 'stepped' or 'blocky'. These are the Bollinger Bands from the 4-hour timeframe. The "steps" indicate where the Upper, Middle, and Lower Band levels were for each 4-hour period.
Practical Uses:
Identifying the Trend: If the blue BB (LTF) is contained within the upper half of the black BB (HTF), it could indicate a pullback within a strong uptrend.
Dynamic Support & Resistance Zones: The black HTF bands can act as very strong long-term support or resistance zones. For example, if the price on a 15-minute chart drops to the H4 Lower Band, it might be a good buying zone.
Spotting Volatility Squeezes: You can see if both sets of Bollinger Bands are contracting simultaneously, signaling that a significant price move may be imminent.
In short, this script is a visual dashboard that allows you to make trading decisions on a lower timeframe with full awareness of the market context on a larger timeframe.
1. Core Purpose
The main purpose of this script is to display two sets of Bollinger Bands (BB) from two different timeframes on a single chart. It is a visual analysis tool designed to help traders see the market from two perspectives simultaneously:
Short-Term Perspective (LTF): Current price action and volatility.
Long-Term Perspective (HTF): The broader trend and significant "value zones."
2. Key Features & Settings
The script is highly flexible, as nearly all elements can be modified through the Settings menu (⚙️ icon). It is divided into two main sections:
Section 1: Current Timeframe (LTF) Settings
BB Length (Length): Determines the period for the moving average (default: 20).
Standard Deviation (StdDev): Sets the width of the Bollinger Bands (default: 2.0).
Color: Allows you to change the color for this BB set (default: Blue).
Section 2: Higher Timeframe (HTF) Settings
Select Higher Timeframe (Timeframe): This is the most important setting. Here you can choose your reference timeframe, for example, "240" (4-Hour), "D" (Daily), or "W" (Weekly).
BB Length & StdDev: Similar to the LTF, you can set the BB parameters for the HTF independently.
Color & Line Thickness: You can change the color (default: Black) and also the line thickness to easily distinguish it from the current timeframe's BB.
3. How It Works
The script performs two parallel calculations:
LTF Calculation: It calculates the Bollinger Bands normally using the price data from the timeframe you are currently viewing on your chart (e.g., 15-Minute). The result is the blue lines that move smoothly with each candle.
HTF Calculation: This is the more complex part.
It uses the request.security() function to "request" the Bollinger Bands data from the higher timeframe (e.g., 4-Hour) that you have set.
To ensure the displayed data is accurate and does not "repaint," it fetches the BB values from the HTF candle that has already closed.
This means that the BB value from a single 4-hour candle will remain constant and be plotted as a flat line across all the 15-minute candles that fall within that 4-hour period.
4. What You See on the Chart (Visual Output)
When you add this script to a chart (for example, a 15-minute chart), you will see:
One set of blue Bollinger Bands that closely "hugs" the 15-minute price. This shows the short-term volatility.
Another set of thicker, black Bollinger Bands that appear 'stepped' or 'blocky'. These are the Bollinger Bands from the 4-hour timeframe. The "steps" indicate where the Upper, Middle, and Lower Band levels were for each 4-hour period.
Practical Uses:
Identifying the Trend: If the blue BB (LTF) is contained within the upper half of the black BB (HTF), it could indicate a pullback within a strong uptrend.
Dynamic Support & Resistance Zones: The black HTF bands can act as very strong long-term support or resistance zones. For example, if the price on a 15-minute chart drops to the H4 Lower Band, it might be a good buying zone.
Spotting Volatility Squeezes: You can see if both sets of Bollinger Bands are contracting simultaneously, signaling that a significant price move may be imminent.
In short, this script is a visual dashboard that allows you to make trading decisions on a lower timeframe with full awareness of the market context on a larger timeframe.
Korumalı komut dosyası
Bu komut dosyası kapalı kaynak olarak yayınlanmaktadır. Ancak, özgürce ve herhangi bir sınırlama olmaksızın kullanabilirsiniz – daha fazla bilgi burada.
Feragatname
Bilgiler ve yayınlar, TradingView tarafından sağlanan veya onaylanan finansal, yatırım, işlem veya diğer türden tavsiye veya tavsiyeler anlamına gelmez ve teşkil etmez. Kullanım Şartları'nda daha fazlasını okuyun.