PROTECTED SOURCE SCRIPT
itradesize /\ Previous Liquidity x ICT
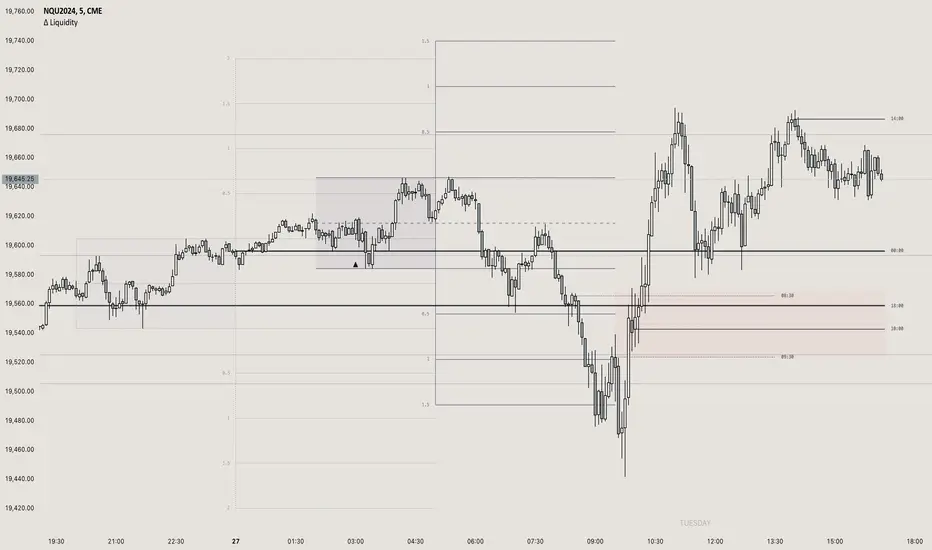
I’d like to introduce a clean and simple RTH gap and liquidity levels indicator with additional Asian and London ranges, along with standard deviation levels and many customizable options.
Previous D/W/M highs and lows are areas where liquidity tends to accumulate. This is because many traders place stop-loss orders around these levels, creating a concentration of buy stops above the previous day's high and sell stops below the previous day's low. High-frequency trading algorithms and institutional traders often target these areas to capture liquidity.
What the indicator could show in summary?
- Regular trading hours gap with deviations
- Asia with deviations (lines or boxes)
- London with deviations (lines or boxes)
- Weekdays on chart
- 3 AM candle marker
- Previous D/W/M levels
- Important opening times (08:00, 09:30, 10:00, 14:00, 00:00, 18:00) - Daily separators
By marking out the previous day's highs and lows, traders can create a framework for their trading day. This helps in identifying potential setups and understanding where significant price action might occur. It also aids in filtering out noise and focusing on the most relevant price levels.
These levels can also act as potential reversal points. When the market reaches a previous high or low, it might reverse direction, especially if it has raided the liquidity resting there. This concept is part of a strategy where traders look for the market to raid these levels and then reverse, providing trading opportunities
The indicator shows previous liquidity levels on a daily, weekly, and monthly basis. It also displays opening times at 8:30, 9:30-10:00, 14:00-00:00, and 18:00. Opening times are crucial in trading because they help define specific periods when market activity is expected to be higher, which can lead to better trading opportunities. The script has been made mostly for indices.
You can create various entry and exit strategies based on the indicator. Please remember, that adequate knowledge of ICT is necessary for this to be beneficial.
You might wonder why only these times are shown. This is because these are the times when the futures market is active or should be active. It's important to note that opening times can vary between different asset classes.
18:00 A new daily candle open
00:00 Midnight open
02:00 New 4-hour candle open
08:30 High-impact news
09:30 NY Equities open
10:00 New 4-hour candle open
The concept of "Asian Killzone Standard Deviations" involves using the Asian trading session's price range to project potential price movements during subsequent trading sessions, such as the London or New York sessions. This is done by calculating standard deviations from the Asian range, which can help traders identify potential support and resistance levels.
You can create a complete model by exclusively focusing on the Asian time zone. Deviations within this zone may have varying impacts on future price movements, and the Interbank Price Delivery Agreement (IPDA) often reflects Asia's high, close, and low prices.
A similar approach can be taken with the London time zone. The standard deviation levels within each zone could potentially serve as support or indicate reversals, including liquidity hunts. It's important to backtest these ideas to gain reliable insights into when and where to apply them.
* Asian Range: This is the price range established during the Asian trading session. It serves as a reference point for calculating standard deviations.
* London Range: The same applies to the London range as well. Combine standard deviation projections with other technical analysis tools, such as order blocks or fair value gaps, to enhance accuracy.
* Standard Deviations: These are statistical measures that indicate the amount of variation or dispersion from the average. In trading, they are used to project potential price levels beyond the current range.
You can also use regular trading hours gap as a standalone model. The 4 STDV and 2.5 STDV levels are important for determining the high or low of the current price action.
The RTH gap is created when there is a difference between the closing price of a market at the end of one trading day and the opening price at the start of the next trading day. This gap can be upward (gap higher), downward (gap lower), or unchanged. It is significant because it often indicates market sentiment and can create inefficiencies that traders look to exploit.
Alternatively, you can combine these elements to create a complete strategy for different scenarios.
Korumalı komut dosyası
Bu komut dosyası kapalı kaynak olarak yayınlanmaktadır. Ancak, ücretsiz ve herhangi bir sınırlama olmaksızın kullanabilirsiniz – daha fazla bilgiyi buradan edinebilirsiniz.
Feragatname
Bilgiler ve yayınlar, TradingView tarafından sağlanan veya onaylanan finansal, yatırım, alım satım veya diğer türden tavsiye veya öneriler anlamına gelmez ve teşkil etmez. Kullanım Koşulları bölümünde daha fazlasını okuyun.