OPEN-SOURCE SCRIPT
Güncellendi Seasonality: Month Highlight
Many Assets, especially Commodities , have patterns of seasonality: Periods in the year when they have shown a greater tendency to rise or a greater tendency to fall.
The Seasonality of an asset is based on historical data (20yrs+): Specific asset seasonality charts can be found via an online search.
This is a simple tool that allows users to highlight and color code each of the 12 months of the year; depending on the seasonality of the specific asset.
The above chart shows Sugar Futures ; which are a seasonal 'sell' in February , and a seasonal 'buy' in May and August.
Seasonality should only be used to compliment a trading setup, NOT as a single reason in itself to buy or sell. Simply put: if you find a good setup, AND you have seasonality on your side; your odds of success are increased.
Sürüm Notları
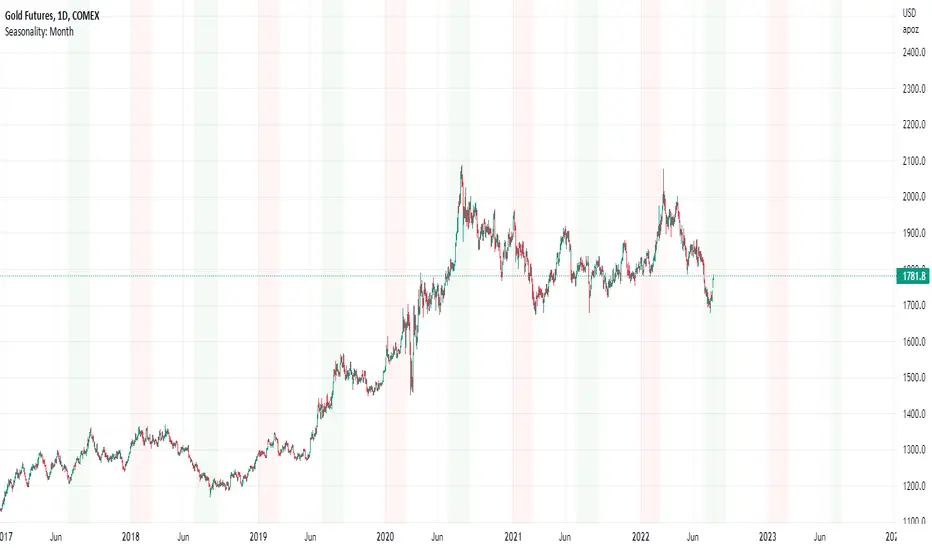
~Now plots future & past background month highlights (future highlight only on Daily timeframe)~More formatting options; choose each month and choose its respective background color
~Shown above with Gold seasonal tendency bullish/bearish months
Sürüm Notları
Correction: Rather than saying "Gold seasonal tendency bullish/bearish months";
More properly I should say, months where one might look for a seasonally supported 'Buy' or a seasonally supported 'Sell' in Gold
Açık kaynak kodlu komut dosyası
Gerçek TradingView ruhuyla, bu komut dosyasının mimarı, yatırımcıların işlevselliğini inceleyip doğrulayabilmesi için onu açık kaynaklı hale getirdi. Yazarı tebrik ederiz! Ücretsiz olarak kullanabilseniz de, kodu yeniden yayınlamanın Topluluk Kurallarımıza tabi olduğunu unutmayın.
You can buy me a coffee here...
PayPal.Me/twingall
BTC: 3JrhUwNRnKyqhaa1n1AXKeAubNeEFoch6S
ETH erc20: 0x4b0400B1c18503529ab69611e82a934DDe4Ab038
ETH bep20: 0x1F0f03F184079bb1085F8C9dF3a8191C9f5869B3
PayPal.Me/twingall
BTC: 3JrhUwNRnKyqhaa1n1AXKeAubNeEFoch6S
ETH erc20: 0x4b0400B1c18503529ab69611e82a934DDe4Ab038
ETH bep20: 0x1F0f03F184079bb1085F8C9dF3a8191C9f5869B3
Feragatname
Bilgiler ve yayınlar, TradingView tarafından sağlanan veya onaylanan finansal, yatırım, alım satım veya diğer türden tavsiye veya öneriler anlamına gelmez ve teşkil etmez. Kullanım Koşulları bölümünde daha fazlasını okuyun.