PROTECTED SOURCE SCRIPT
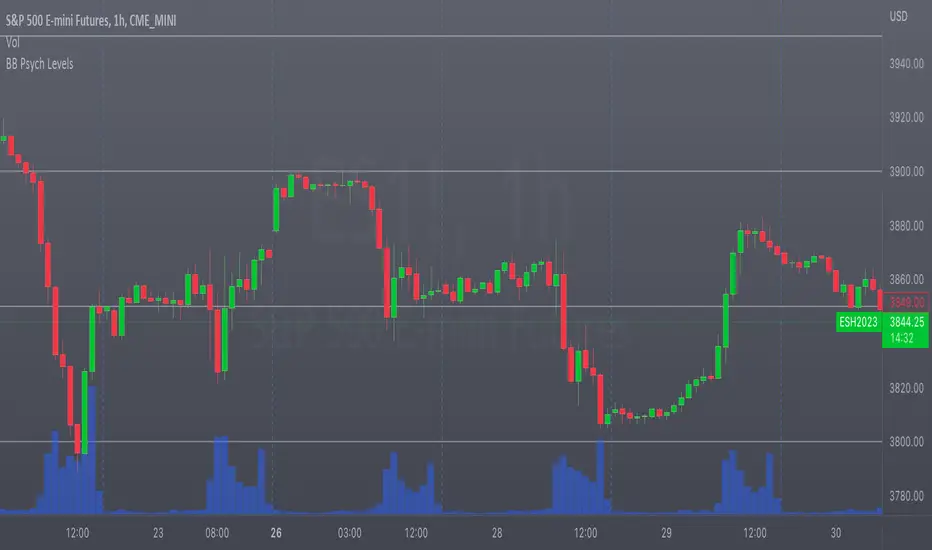
BullBarbie's Automagical Psych Levels v1.1

This indicator does one thing (and it does it extremely well)...
Automatically plot levels at a set a set interval in a set range to create psychological levels on your chart.
There are 3 Options:
1) The price range in which you'd like to plot these level lines
2) The interval (price range) between the levels
3) The color/style you'd like the line to by
No nonsense, just KISS: Keep It Simple, Silly.
I created this script to easily add psychological (psych) levels to my most watched charts, especially the Indexes such as SPX, SPY, QQQ... I hope you enjoy it.
Korumalı komut dosyası
Bu komut dosyası kapalı kaynak olarak yayınlanmaktadır. Ancak, ücretsiz ve herhangi bir sınırlama olmaksızın kullanabilirsiniz – daha fazla bilgiyi buradan edinebilirsiniz.
Feragatname
Bilgiler ve yayınlar, TradingView tarafından sağlanan veya onaylanan finansal, yatırım, alım satım veya diğer türden tavsiye veya öneriler anlamına gelmez ve teşkil etmez. Kullanım Koşulları bölümünde daha fazlasını okuyun.