OPEN-SOURCE SCRIPT
Chart Patterns Buy Alerts (Intraday) - Bullish Patterns
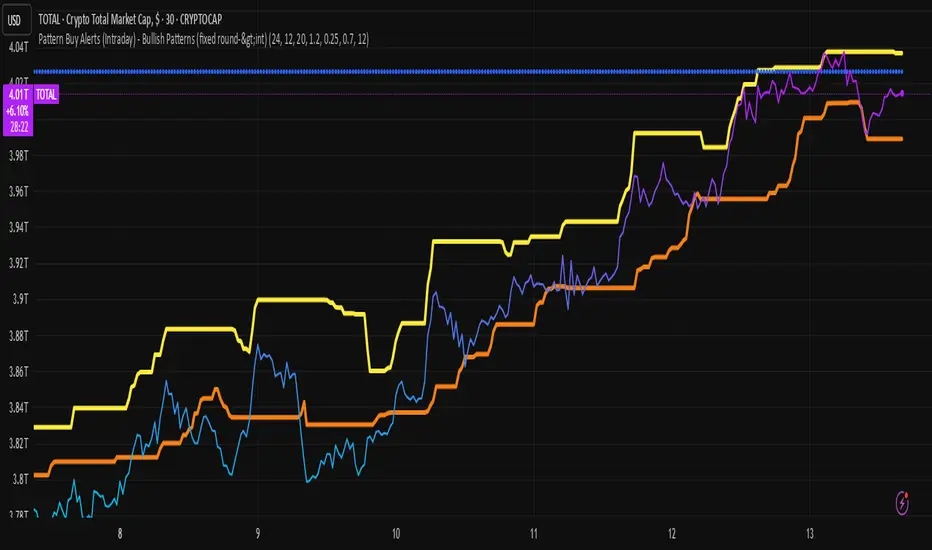
chart pattern prediction
The script plots two things:
predicted_direction → +1 (up) or -1 (down).
predicted_value → the next bar’s estimated close price.
So on your chart you’ll see:
Blue histogram → shows up (+1) or down (-1) prediction.
Orange line → predicted next value.
Interpret the Output
If the blue bar is +1, the model expects the next candle to close higher.
If the blue bar is -1, the model expects the next candle to close lower.
The orange line shows where it thinks the next close will land.
Açık kaynak kodlu komut dosyası
Gerçek TradingView ruhuyla, bu komut dosyasının mimarı, yatırımcıların işlevselliğini inceleyip doğrulayabilmesi için onu açık kaynaklı hale getirdi. Yazarı tebrik ederiz! Ücretsiz olarak kullanabilseniz de, kodu yeniden yayınlamanın Topluluk Kurallarımıza tabi olduğunu unutmayın.
Feragatname
Bilgiler ve yayınlar, TradingView tarafından sağlanan veya onaylanan finansal, yatırım, alım satım veya diğer türden tavsiye veya öneriler anlamına gelmez ve teşkil etmez. Kullanım Koşulları bölümünde daha fazlasını okuyun.