PROTECTED SOURCE SCRIPT
Güncellendi BTC Market Top and Bottom
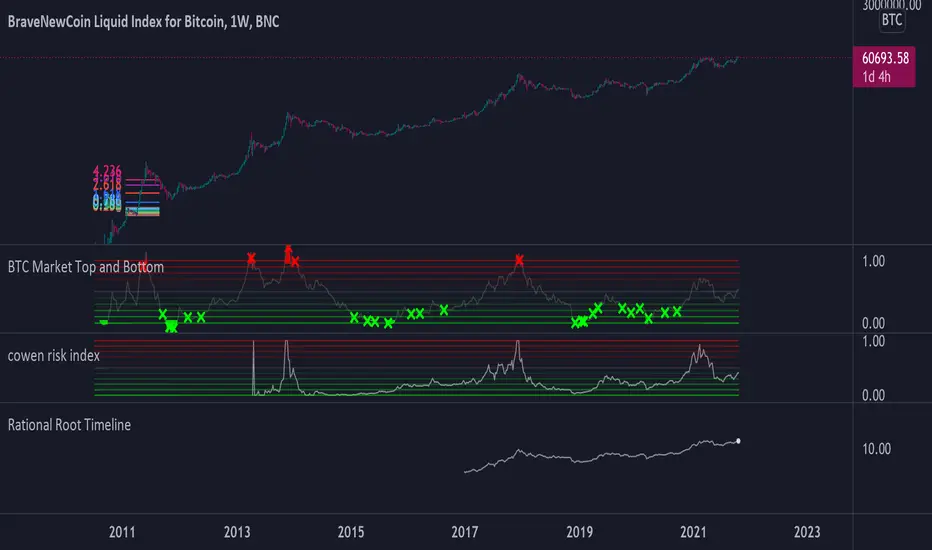
This script is a logarithmic moving average oscillator for the daily BTC chart (Or any asset ideally with data more than 4 years in length) to help find the top and bottom of the entire cycle. The idea is to buy when the oscillator is near green and sell when things are near the red. Should be used in conjunction with shorter timeframe indicators to find your best entries. This just shows the overall position of the cycle.
Instructions:
Use on a Daily BTCUSD chart or BLX chart. The more data the better.
Adjust the length to around 1000-1500 (this mainly controls the green line)
Adjust the denominator (this mainly controls the red line)
Adjust the smoothness (for visual appeal and noise reduction)
Instructions:
Use on a Daily BTCUSD chart or BLX chart. The more data the better.
Adjust the length to around 1000-1500 (this mainly controls the green line)
Adjust the denominator (this mainly controls the red line)
Adjust the smoothness (for visual appeal and noise reduction)
Sürüm Notları
Converted to security function to show Daily on all timeframes. Changed signal line to a function to allow for an incrementing sma inside the security function. Sürüm Notları
Added a momentum function to the signal. This should help spot when the momentum is potentially reversing when the signal is higher than momentum top and less than momentum bottom. You can adjust them in the settings.Sürüm Notları
Added risk levelsKorumalı komut dosyası
Bu komut dosyası kapalı kaynak olarak yayınlanmaktadır. Ancak, ücretsiz ve herhangi bir sınırlama olmaksızın kullanabilirsiniz – daha fazla bilgiyi buradan edinebilirsiniz.
Feragatname
Bilgiler ve yayınlar, TradingView tarafından sağlanan veya onaylanan finansal, yatırım, alım satım veya diğer türden tavsiye veya öneriler anlamına gelmez ve teşkil etmez. Kullanım Koşulları bölümünde daha fazlasını okuyun.
Korumalı komut dosyası
Bu komut dosyası kapalı kaynak olarak yayınlanmaktadır. Ancak, ücretsiz ve herhangi bir sınırlama olmaksızın kullanabilirsiniz – daha fazla bilgiyi buradan edinebilirsiniz.
Feragatname
Bilgiler ve yayınlar, TradingView tarafından sağlanan veya onaylanan finansal, yatırım, alım satım veya diğer türden tavsiye veya öneriler anlamına gelmez ve teşkil etmez. Kullanım Koşulları bölümünde daha fazlasını okuyun.