OPEN-SOURCE SCRIPT
Güncellendi Bitcoin Risk Metric II
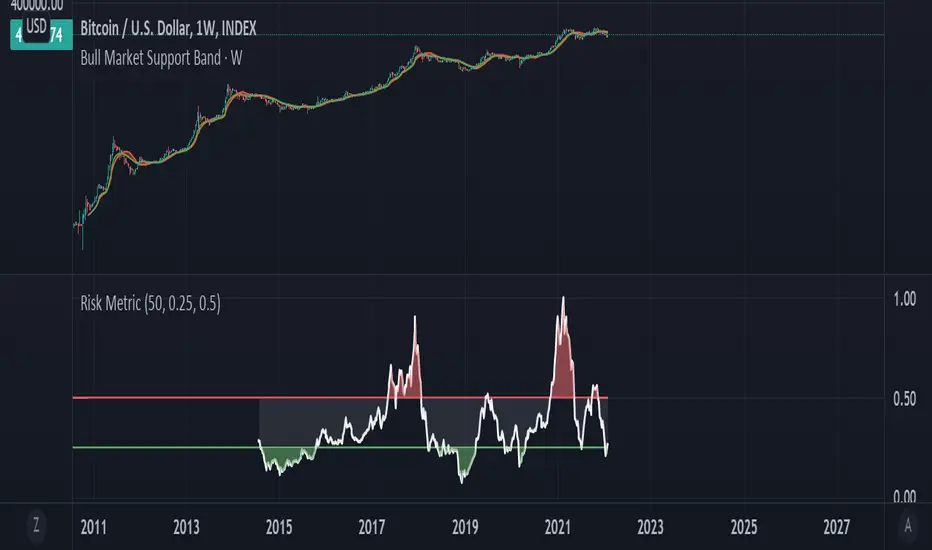
Thesis: Bitcoin's price movements can be (dubiously) characterized by functional relationships between moving averages and standard deviations. These movements can be normalized into a risk metric through normalization functions of time. This risk metric may be able to quantify a long term "buy low, sell high" strategy.
This risk metric is the average of three normalized metrics:
1. (btc - 4 yma)/ (std dev)
2. ln(btc / 20 wma)
3. (50 dma)/(50 wma)
* btc = btc price
* yma = yearly moving average of btc, wma = weekly moving average of btc, dma = daily moving average of btc
* std dev = std dev of btc
Important note:
Historical data for this metric is only shown back until 2014, because of the nature of the 1st mentioned metric. The other two metrics produce a value back until 2011. A previous, less robust, version of metric 2 is posted on my TradingView as well.
Sürüm Notları
Tidied up code. Açık kaynak kodlu komut dosyası
Gerçek TradingView ruhuyla, bu komut dosyasının mimarı, yatırımcıların işlevselliğini inceleyip doğrulayabilmesi için onu açık kaynaklı hale getirdi. Yazarı tebrik ederiz! Ücretsiz olarak kullanabilseniz de, kodu yeniden yayınlamanın Topluluk Kurallarımıza tabi olduğunu unutmayın.
Feragatname
Bilgiler ve yayınlar, TradingView tarafından sağlanan veya onaylanan finansal, yatırım, alım satım veya diğer türden tavsiye veya öneriler anlamına gelmez ve teşkil etmez. Kullanım Koşulları bölümünde daha fazlasını okuyun.
Açık kaynak kodlu komut dosyası
Gerçek TradingView ruhuyla, bu komut dosyasının mimarı, yatırımcıların işlevselliğini inceleyip doğrulayabilmesi için onu açık kaynaklı hale getirdi. Yazarı tebrik ederiz! Ücretsiz olarak kullanabilseniz de, kodu yeniden yayınlamanın Topluluk Kurallarımıza tabi olduğunu unutmayın.
Feragatname
Bilgiler ve yayınlar, TradingView tarafından sağlanan veya onaylanan finansal, yatırım, alım satım veya diğer türden tavsiye veya öneriler anlamına gelmez ve teşkil etmez. Kullanım Koşulları bölümünde daha fazlasını okuyun.