PROTECTED SOURCE SCRIPT
atrATR
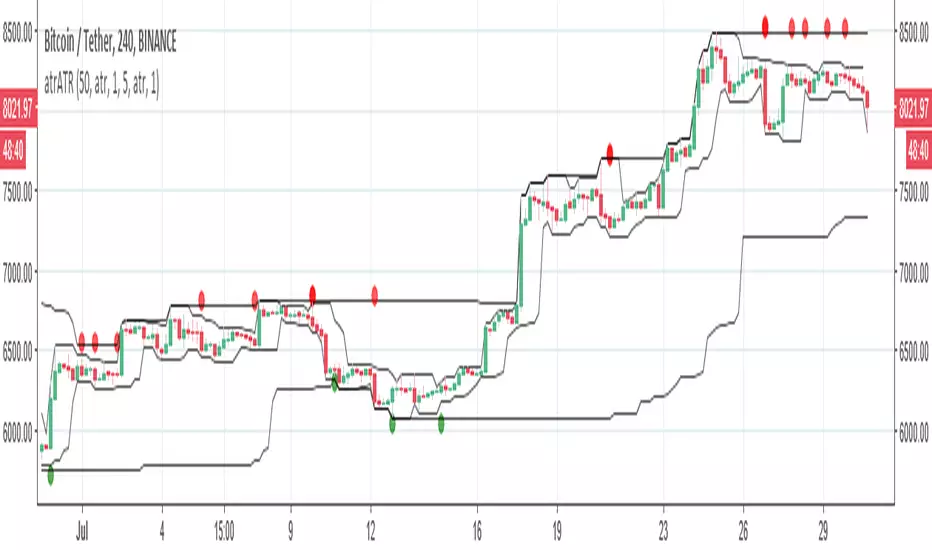
so this easy to see indicator based on ATR and donochian channel
there is fast and there is slow channels . when they are kissing each other then either in the low point or high point is change of trend. for example: the price went to high point and the fast channel is departing down from the slow this is time to sell.
the opposite when the fast channel departing up from the slow channel
it the same mechanism of the linear regression just more accurate.
the circles are just point where ATR think it time to buy or sell. but this is easy way to think on trends and to figure out if you going short or long
Korumalı komut dosyası
Bu komut dosyası kapalı kaynak olarak yayınlanmaktadır. Ancak, ücretsiz ve herhangi bir sınırlama olmaksızın kullanabilirsiniz – daha fazla bilgiyi buradan edinebilirsiniz.
Feragatname
Bilgiler ve yayınlar, TradingView tarafından sağlanan veya onaylanan finansal, yatırım, alım satım veya diğer türden tavsiye veya öneriler anlamına gelmez ve teşkil etmez. Kullanım Koşulları bölümünde daha fazlasını okuyun.