PROTECTED SOURCE SCRIPT
TrendFlow
The TrendFlow_VolHub is a clean, trend-following indicator built on a simple yet effective core of Exponential Moving Averages (EMAs). It provides clear visual cues for trend direction, volatility, and key support/resistance levels.
Key Features
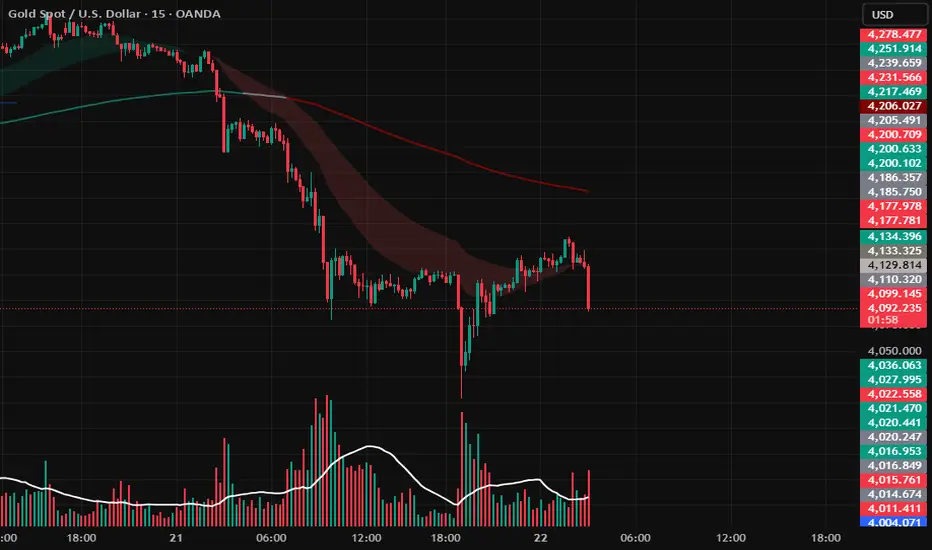
Dynamic EMA Ribbon (21/50):
The area between the EMA 21 and EMA 50 is filled with color to clearly visualize the short-term trend momentum.
Green Fill: EMA 21 is above EMA 50 (Bullish Momentum).
Red Fill: EMA 21 is below EMA 50 (Bearish Momentum).
A user-adjustable Fill Opacity input (0-100) is included for customization.
Dynamic EMA 200 (Long-Term Filter):
The EMA 200 serves as a powerful long-term trend filter and major support/resistance.
Its color dynamically changes based on its position relative to the EMA 21 and EMA 50:
Teal/Green: EMA 200 is below both the 21 and 50 (Strong Bullish Alignment).
Red/Maroon: EMA 200 is above both the 21 and 50 (Strong Bearish Alignment).
Gray: The EMAs are crossing or choppy (Neutral/Consolidation).
Suggested Use
Trend Confirmation: Use the Ribbon color (Green/Red) to confirm the immediate directional bias.
Trend Strength: Use the EMA 200 color as a high-level filter. A bullish ribbon (green) combined with a teal/green 200 EMA suggests a high-conviction uptrend.
Dynamic S/R: The EMA lines themselves can be used as dynamic support and resistance levels.
Key Features
Dynamic EMA Ribbon (21/50):
The area between the EMA 21 and EMA 50 is filled with color to clearly visualize the short-term trend momentum.
Green Fill: EMA 21 is above EMA 50 (Bullish Momentum).
Red Fill: EMA 21 is below EMA 50 (Bearish Momentum).
A user-adjustable Fill Opacity input (0-100) is included for customization.
Dynamic EMA 200 (Long-Term Filter):
The EMA 200 serves as a powerful long-term trend filter and major support/resistance.
Its color dynamically changes based on its position relative to the EMA 21 and EMA 50:
Teal/Green: EMA 200 is below both the 21 and 50 (Strong Bullish Alignment).
Red/Maroon: EMA 200 is above both the 21 and 50 (Strong Bearish Alignment).
Gray: The EMAs are crossing or choppy (Neutral/Consolidation).
Suggested Use
Trend Confirmation: Use the Ribbon color (Green/Red) to confirm the immediate directional bias.
Trend Strength: Use the EMA 200 color as a high-level filter. A bullish ribbon (green) combined with a teal/green 200 EMA suggests a high-conviction uptrend.
Dynamic S/R: The EMA lines themselves can be used as dynamic support and resistance levels.
Korumalı komut dosyası
Bu komut dosyası kapalı kaynak olarak yayınlanmaktadır. Ancak, özgürce ve herhangi bir sınırlama olmaksızın kullanabilirsiniz – daha fazla bilgi burada.
Feragatname
Bilgiler ve yayınlar, TradingView tarafından sağlanan veya onaylanan finansal, yatırım, işlem veya diğer türden tavsiye veya tavsiyeler anlamına gelmez ve teşkil etmez. Kullanım Şartları'nda daha fazlasını okuyun.