Trends
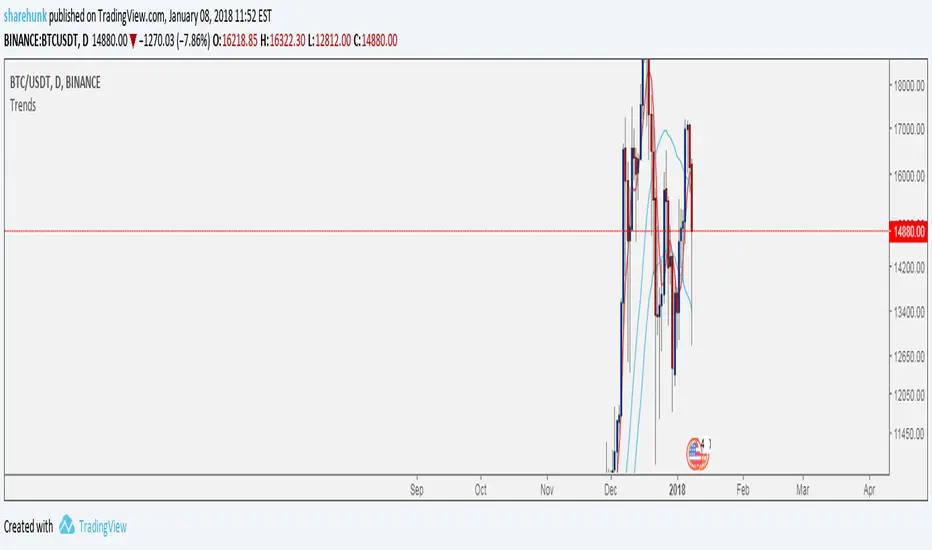
a) For an up trending market [ Price is above the RED line and the RED line is above the two BLUE lines ]
A good BUY is when price reaches/drops near the RED line.
b) For a down trending market [ RED line is above the price and the two BLUE lines are above the RED line ]
A good SELL is when the price rises to the RED line.
Keeping it Simple !
Disclaimer : Trading involves risk, this script/strategy is not trading advise, rather it can act as a tool among others to gain confidence to enter a trade.
Yalnızca davetli komut dosyası
Bu komut dosyasına yalnızca yazar tarafından onaylanan kullanıcılar erişebilir. Kullanmak için izin istemeniz ve almanız gerekir. Bu genellikle ödeme yapıldıktan sonra verilir. Daha fazla ayrıntı için aşağıdaki yazarın talimatlarını izleyin veya doğrudan sharehunk ile iletişime geçin.
TradingView, yazarına tamamen güvenmediğiniz ve nasıl çalıştığını anlamadığınız sürece bir komut dosyası için ödeme yapmanızı veya kullanmanızı TAVSİYE ETMEZ. Ayrıca topluluk komut dosyalarımızda ücretsiz, açık kaynaklı alternatifler bulabilirsiniz.
Yazarın talimatları
Feragatname
Yalnızca davetli komut dosyası
Bu komut dosyasına yalnızca yazar tarafından onaylanan kullanıcılar erişebilir. Kullanmak için izin istemeniz ve almanız gerekir. Bu genellikle ödeme yapıldıktan sonra verilir. Daha fazla ayrıntı için aşağıdaki yazarın talimatlarını izleyin veya doğrudan sharehunk ile iletişime geçin.
TradingView, yazarına tamamen güvenmediğiniz ve nasıl çalıştığını anlamadığınız sürece bir komut dosyası için ödeme yapmanızı veya kullanmanızı TAVSİYE ETMEZ. Ayrıca topluluk komut dosyalarımızda ücretsiz, açık kaynaklı alternatifler bulabilirsiniz.