OPEN-SOURCE SCRIPT
%Bs
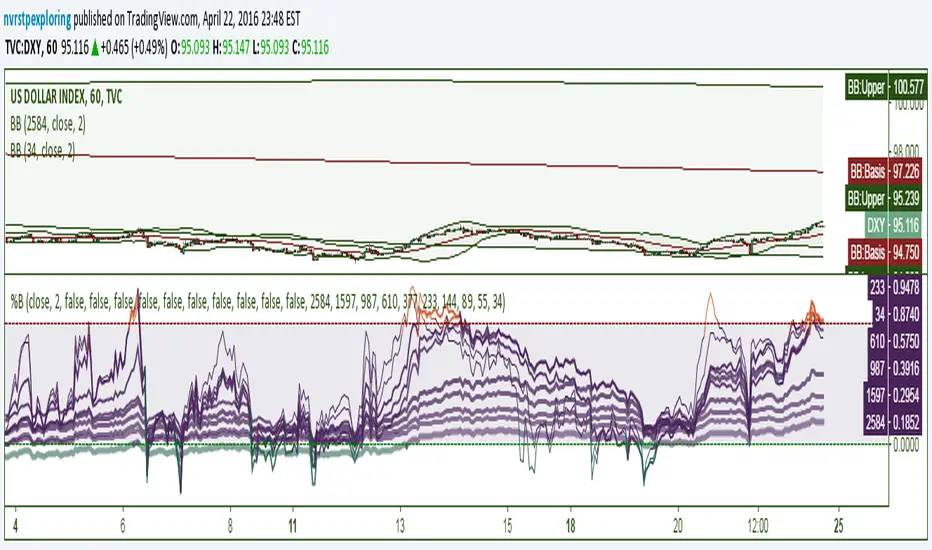
An indicator with 10 configurable %B lines for identifying trends, overbought and oversold conditions, and reversal points. %B is a linear representation of a securities relationship to the Upper and Lower Bollinger Bands. The best opportunities arise when a security is oversold in a bullish trend and overbought in a bearish trend. The longer %B trend-lines in this indicator are very useful for major reversals. They can be used to indicate the high or low of the day on a 1-minute chart or show a multi-year reversal point.
%B = (Current Price - Lower Band) / (Upper Band - Lower Band)
%B = (Current Price - Lower Band) / (Upper Band - Lower Band)
Açık kaynak kodlu komut dosyası
Gerçek TradingView ruhuyla, bu komut dosyasının mimarı, yatırımcıların işlevselliğini inceleyip doğrulayabilmesi için onu açık kaynaklı hale getirdi. Yazarı tebrik ederiz! Ücretsiz olarak kullanabilseniz de, kodu yeniden yayınlamanın Topluluk Kurallarımıza tabi olduğunu unutmayın.
Feragatname
Bilgiler ve yayınlar, TradingView tarafından sağlanan veya onaylanan finansal, yatırım, alım satım veya diğer türden tavsiye veya öneriler anlamına gelmez ve teşkil etmez. Kullanım Koşulları bölümünde daha fazlasını okuyun.