OPEN-SOURCE SCRIPT
Statistical Trend Analysis (Scatterplot) [BigBeluga]
Statistical Trend Analysis (Scatterplot) [BigBeluga] provides a unique perspective on market dynamics by combining the statistical concept of z-scores with scatterplot visualization to assess price momentum and potential trend shifts.
🧿What is Z-Score?
🧿Key Features:
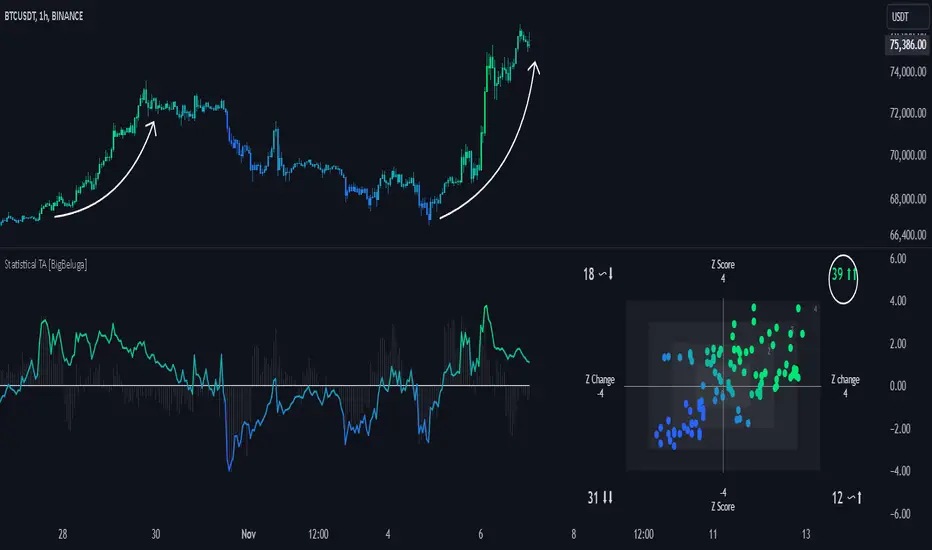
Scatterplot Visualization:
Displays data points of z-score and its change across four quadrants.

Quadrants help interpret market conditions:
Color-Coded Candles:
Z-Score Time Series:
🧿Usage:
This tool is ideal for traders who rely on statistical insights to confirm trends, detect potential reversals, and assess market momentum visually and quantitatively.
🧿What is Z-Score?
- Definition: A z-score is a statistical measure that quantifies how far a data point is from the mean, expressed in terms of standard deviations.
- In this Indicator:
- A high positive z-score indicates the price is significantly above the average.
- A low negative z-score indicates the price is significantly below the average.
- The indicator also calculates the rate of change of the z-score, helping identify momentum shifts in the market.
🧿Key Features:
Scatterplot Visualization:
Displays data points of z-score and its change across four quadrants.
Quadrants help interpret market conditions:
- Upper Right (Strong Bullish Momentum): Most data points here signal an ongoing uptrend.
- Upper Left (Weakening Momentum): Data points here may indicate a potential market shift or ranging market.
- Lower Left (Strong Bearish Momentum): Indicates a dominant downtrend.
- Lower Right (Trend Shift to Bullish/Ranging): Suggests weakening bearish momentum or an emerging uptrend.
Color-Coded Candles:
- Candles are dynamically colored based on the z-score, providing a visual cue about the price's deviation from the mean.
Z-Score Time Series:
- A line plot of z-scores over time shows price deviation trends.
- A gray histogram displays the rate of change of the z-score, highlighting momentum shifts.
🧿Usage:
- Use the scatterplot and quadrant gauges to understand the current market momentum and potential shifts.
- Monitor the z-score line plot to identify overbought/oversold conditions.
- Utilize the gray histogram to detect momentum reversals and trend strength.
This tool is ideal for traders who rely on statistical insights to confirm trends, detect potential reversals, and assess market momentum visually and quantitatively.
Açık kaynak kodlu komut dosyası
Gerçek TradingView ruhuyla, bu komut dosyasının mimarı, yatırımcıların işlevselliğini inceleyip doğrulayabilmesi için onu açık kaynaklı hale getirdi. Yazarı tebrik ederiz! Ücretsiz olarak kullanabilseniz de, kodu yeniden yayınlamanın Topluluk Kurallarımıza tabi olduğunu unutmayın.
🔵Gain access to our powerful tools : bigbeluga.com/tv
🔵Join our free discord for updates : bigbeluga.com/discord
All scripts & content provided by BigBeluga are for informational & educational purposes only.
🔵Join our free discord for updates : bigbeluga.com/discord
All scripts & content provided by BigBeluga are for informational & educational purposes only.
Feragatname
Bilgiler ve yayınlar, TradingView tarafından sağlanan veya onaylanan finansal, yatırım, alım satım veya diğer türden tavsiye veya öneriler anlamına gelmez ve teşkil etmez. Kullanım Koşulları bölümünde daha fazlasını okuyun.