OPEN-SOURCE SCRIPT
Hull MA Multi-Time Frame 30 minutes
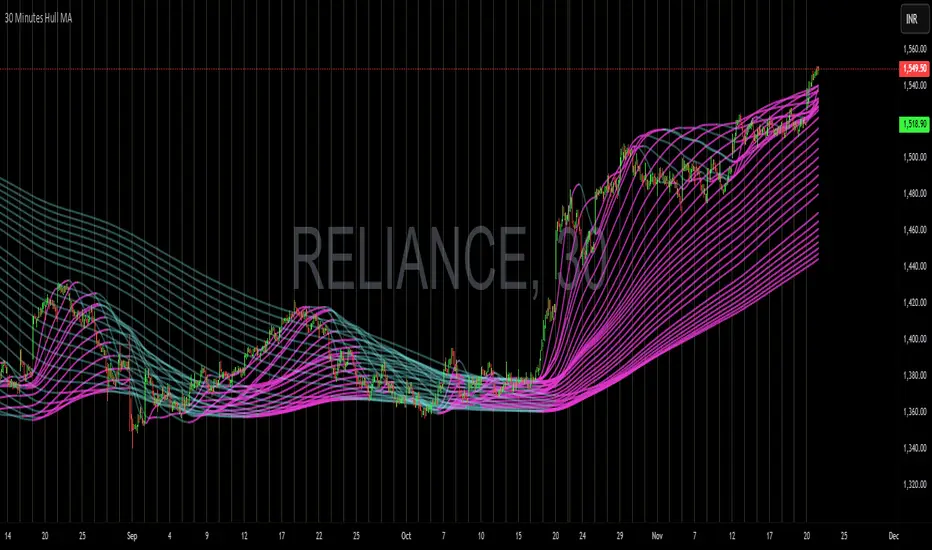
A Hull Moving Average (HMA) plotted on a fixed 30-minute timeframe gives a smooth, lag-free trend indication by filtering out noise.
When multiple HMAs of varying lengths converge near the lower side, it signals bullish accumulation, suggesting that sellers are exhausted and buyers are stepping in.
Conversely, when HMAs form a bouquet or cluster near the top, it indicates distribution or weakening momentum, signaling a potential bearish reversal.
In essence, HMA alignment and convergence act as a visual gauge of trend strength and turning points in market sentiment.
Açık kaynak kodlu komut dosyası
Gerçek TradingView ruhuyla, bu komut dosyasının yaratıcısı, yatırımcıların işlevselliğini inceleyip doğrulayabilmesi için onu açık kaynaklı hale getirdi. Yazarı tebrik ederiz! Ücretsiz olarak kullanabilseniz de, kodu yeniden yayınlamanın Topluluk Kurallarımıza tabi olduğunu unutmayın.
Feragatname
Bilgiler ve yayınlar, TradingView tarafından sağlanan veya onaylanan finansal, yatırım, alım satım veya diğer türden tavsiye veya öneriler anlamına gelmez ve teşkil etmez. Kullanım Koşulları bölümünde daha fazlasını okuyun.