OPEN-SOURCE SCRIPT
Güncellendi OBV Overbuy+sell by RSU
On-balance volume (OBV) is a technical trading momentum indicator that uses volume flow to predict changes in stock price. Joseph Granville first developed the OBV metric in the 1963 book Granville's New Key to Stock Market Profits.
This indicator is based on the OBV indicator and adds 2 times the standard deviation Bollinger Band to evaluate the overbought and oversold phenomenon of the OBV indicator.
The characteristics of Bollinger Bands: According to the normal distribution phenomenon, only 5% of the cases will exceed 2 times the standard deviation of the Bollinger Bands. So when it exceeds, I will use colors to mark red overbought and green oversold situations.
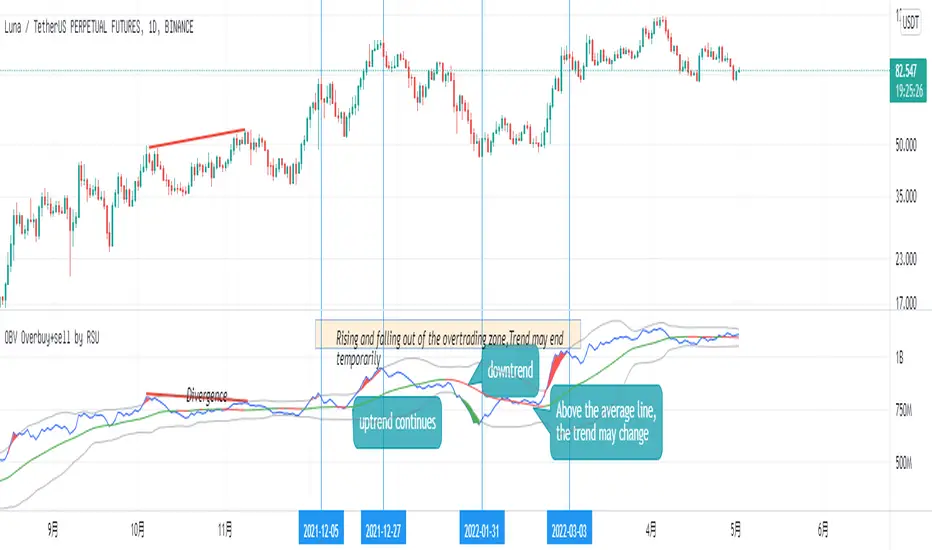
Usage:
1.Identify trends: Identify current stock trends by OBV's 30 average line color.
2.Breakthrough:A break below overbuy could signal a temporary end to the uptrend.
3.Oversell and overbuy:A break below overbuy could signal a temporary end to the uptrend.
4.Divergence:When the slope of the two highs is opposite to the slope of the two highs of the indicator, a trend reversal signal may occur.
This indicator is based on the OBV indicator and adds 2 times the standard deviation Bollinger Band to evaluate the overbought and oversold phenomenon of the OBV indicator.
The characteristics of Bollinger Bands: According to the normal distribution phenomenon, only 5% of the cases will exceed 2 times the standard deviation of the Bollinger Bands. So when it exceeds, I will use colors to mark red overbought and green oversold situations.
Usage:
1.Identify trends: Identify current stock trends by OBV's 30 average line color.
2.Breakthrough:A break below overbuy could signal a temporary end to the uptrend.
3.Oversell and overbuy:A break below overbuy could signal a temporary end to the uptrend.
4.Divergence:When the slope of the two highs is opposite to the slope of the two highs of the indicator, a trend reversal signal may occur.
Sürüm Notları
change:Added smoothing parameter to reduce sawtooth.
Usage:
1.Identify trends: Identify current stock trends by OBV's 30 average line color.
2.Breakthrough:OBV Breakthrough 30 average,signal trend may reversal.
3.Oversell and overbuy:A break below overbuy could signal a temporary end to the uptrend.
4.Divergence:When the slope of the two highs is opposite to the slope of the two highs of the indicator, a trend reversal signal may occur.
Sürüm Notları
changes:Added 1x Bollinger Bands display, updated colors.Açık kaynak kodlu komut dosyası
Gerçek TradingView ruhuyla, bu komut dosyasının mimarı, yatırımcıların işlevselliğini inceleyip doğrulayabilmesi için onu açık kaynaklı hale getirdi. Yazarı tebrik ederiz! Ücretsiz olarak kullanabilseniz de, kodu yeniden yayınlamanın Topluluk Kurallarımıza tabi olduğunu unutmayın.
Feragatname
Bilgiler ve yayınlar, TradingView tarafından sağlanan veya onaylanan finansal, yatırım, alım satım veya diğer türden tavsiye veya öneriler anlamına gelmez ve teşkil etmez. Kullanım Koşulları bölümünde daha fazlasını okuyun.
Açık kaynak kodlu komut dosyası
Gerçek TradingView ruhuyla, bu komut dosyasının mimarı, yatırımcıların işlevselliğini inceleyip doğrulayabilmesi için onu açık kaynaklı hale getirdi. Yazarı tebrik ederiz! Ücretsiz olarak kullanabilseniz de, kodu yeniden yayınlamanın Topluluk Kurallarımıza tabi olduğunu unutmayın.
Feragatname
Bilgiler ve yayınlar, TradingView tarafından sağlanan veya onaylanan finansal, yatırım, alım satım veya diğer türden tavsiye veya öneriler anlamına gelmez ve teşkil etmez. Kullanım Koşulları bölümünde daha fazlasını okuyun.