OPEN-SOURCE SCRIPT
Indicator: Derivative Oscillator
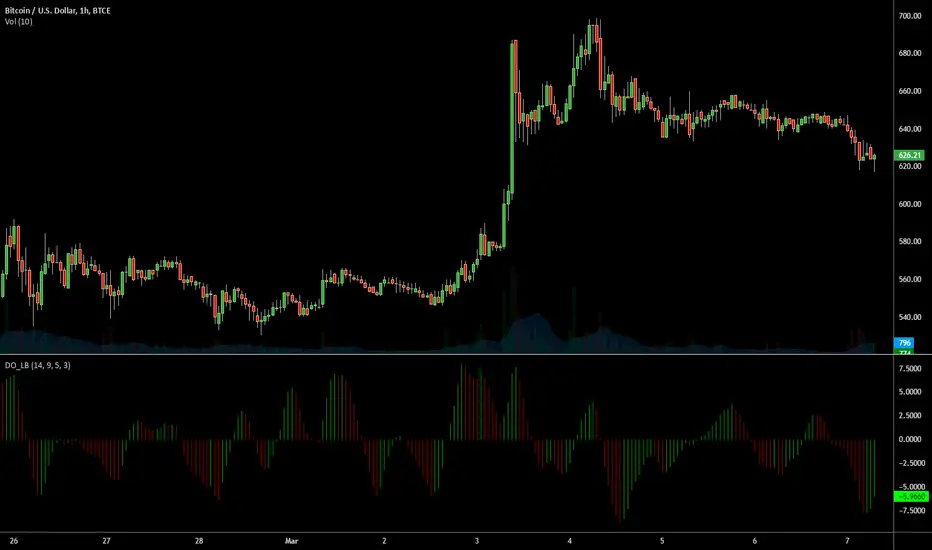
Constance Brown's Derivative Oscillator was published in her book "Technical Analysis for the Trading Professional".
The oscillator uses a 14-period RSI. The RSI is then double smoothed with exponential moving averages. The default settings for the smoothing periods are 5 and 3.
In a second step a signal line is generated from the smoothed RSI by calculating a simple moving average with a period of 9.
The Derivative Oscillator is calculated as the difference between the smoothed RSI and the signal line and displayed as histogram.
All the values are configurable.
Açık kaynak kodlu komut dosyası
Gerçek TradingView ruhuyla, bu komut dosyasının mimarı, yatırımcıların işlevselliğini inceleyip doğrulayabilmesi için onu açık kaynaklı hale getirdi. Yazarı tebrik ederiz! Ücretsiz olarak kullanabilseniz de, kodu yeniden yayınlamanın Topluluk Kurallarımıza tabi olduğunu unutmayın.
List of my free indicators: bit.ly/1LQaPK8
List of my indicators at Appstore: blog.tradingview.com/?p=970
List of my indicators at Appstore: blog.tradingview.com/?p=970
Feragatname
Bilgiler ve yayınlar, TradingView tarafından sağlanan veya onaylanan finansal, yatırım, alım satım veya diğer türden tavsiye veya öneriler anlamına gelmez ve teşkil etmez. Kullanım Koşulları bölümünde daha fazlasını okuyun.