OPEN-SOURCE SCRIPT
Volume Clouds
I know it isn't much, but it is my first time coding an indicator!
You might need to modify distance to fit the volatility and time frame of the chart you are looking at (if candles stay on top of cloud in an ugly mess, increase distance until signals can be seen). Sometimes heikin ashi candles can really help clear the picture up as well.
How to use:
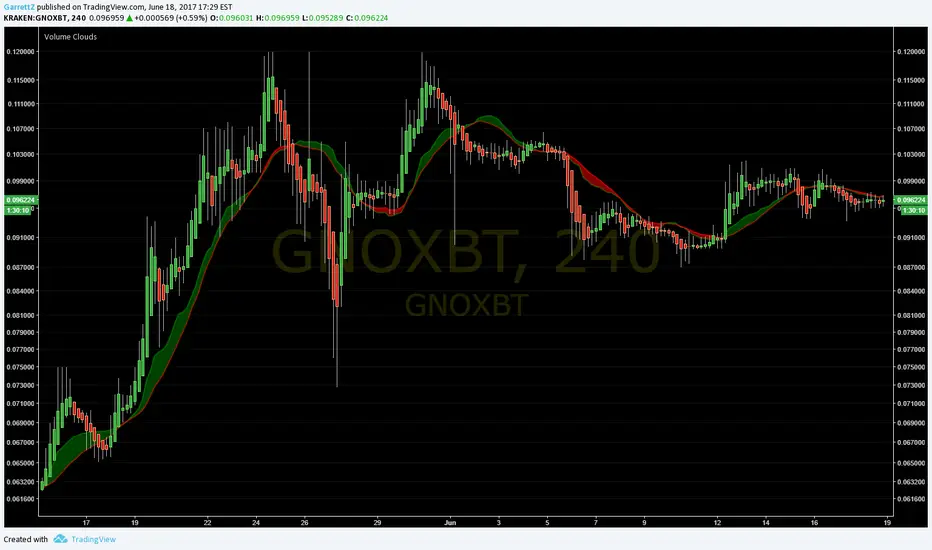
The lines are the Volume Weighted Moving Average (green) and Simple Moving Average (red).
Cloud is green when VWMA is above SMA ( bullish ) and red when SMA is above VWMA ( bearish ).
The thicker the cloud, the stronger the signal. Also, the farther price strays from the cloud, the more pressure there is for it to return.
Look for divergences:
When price passes below a green cloud you have a bullish divergence (or if cloud turns green at crossing point)
Price pass above red cloud = bearish divergence.
Or confirmations:
Price passes below red cloud = bearish confirmation.
Price pass above green cloud = bullish confirmation.
I hope this helps you at least a little! Twitter: GarrettZ
You might need to modify distance to fit the volatility and time frame of the chart you are looking at (if candles stay on top of cloud in an ugly mess, increase distance until signals can be seen). Sometimes heikin ashi candles can really help clear the picture up as well.
How to use:
The lines are the Volume Weighted Moving Average (green) and Simple Moving Average (red).
Cloud is green when VWMA is above SMA ( bullish ) and red when SMA is above VWMA ( bearish ).
The thicker the cloud, the stronger the signal. Also, the farther price strays from the cloud, the more pressure there is for it to return.
Look for divergences:
When price passes below a green cloud you have a bullish divergence (or if cloud turns green at crossing point)
Price pass above red cloud = bearish divergence.
Or confirmations:
Price passes below red cloud = bearish confirmation.
Price pass above green cloud = bullish confirmation.
I hope this helps you at least a little! Twitter: GarrettZ
Açık kaynak kodlu komut dosyası
Gerçek TradingView ruhuyla, bu komut dosyasının mimarı, yatırımcıların işlevselliğini inceleyip doğrulayabilmesi için onu açık kaynaklı hale getirdi. Yazarı tebrik ederiz! Ücretsiz olarak kullanabilseniz de, kodu yeniden yayınlamanın Topluluk Kurallarımıza tabi olduğunu unutmayın.
Feragatname
Bilgiler ve yayınlar, TradingView tarafından sağlanan veya onaylanan finansal, yatırım, alım satım veya diğer türden tavsiye veya öneriler anlamına gelmez ve teşkil etmez. Kullanım Koşulları bölümünde daha fazlasını okuyun.