OPEN-SOURCE SCRIPT
Volume + Volatility
Before I begin I want to mention:
1. This is a variation of the 'CCI & BB' made by matsu_bitmex (Link: tradingview.com/script/IkciCgbh/) and SigmaDraconis's 'On Balance Volume Oscillator + Bollinger Bands' (Link: tradingview.com/script/0MbvTUui-On-Balance-Volume-Oscillator-Bollinger-Bands-SigmaDraconis/)
2. While using this sometimes you may not notice the crossover so I've added the Line 'x' outside 'x' BB to only see if Line 3 and 4 crossed over
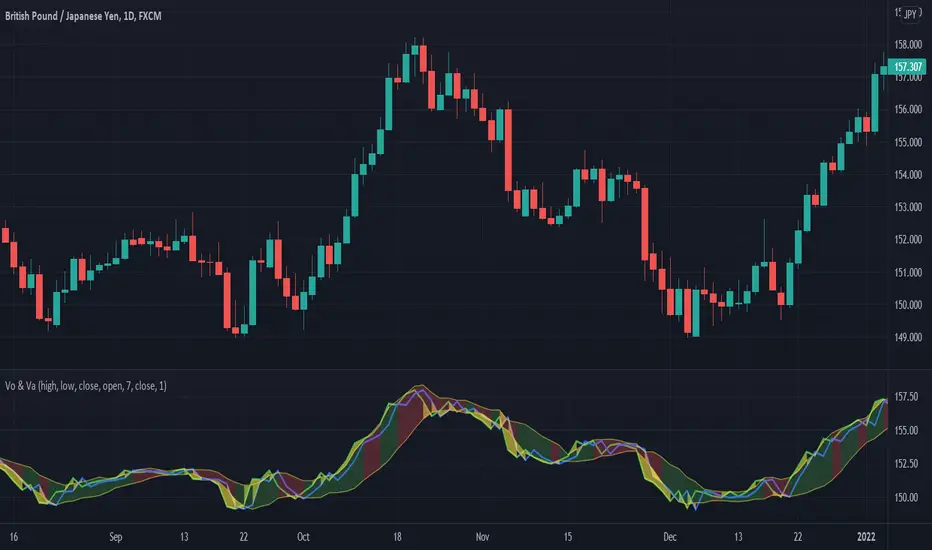
The indicator:
1. When the background is green and the 2 lines are going up it means uptrend
2. When the background is red and the 2 lines are going down it means downtrend
3. When there is a crossover and the background outside BB turns yellow, it means there is a lot of volatility or volume
How to use (Or how I use this):
1. All trades based on the yellow color MUST be during a trend
2. When the color changes to yellow for the 1st time in the direction of a trend it is advisable to enter
1. This is a variation of the 'CCI & BB' made by matsu_bitmex (Link: tradingview.com/script/IkciCgbh/) and SigmaDraconis's 'On Balance Volume Oscillator + Bollinger Bands' (Link: tradingview.com/script/0MbvTUui-On-Balance-Volume-Oscillator-Bollinger-Bands-SigmaDraconis/)
2. While using this sometimes you may not notice the crossover so I've added the Line 'x' outside 'x' BB to only see if Line 3 and 4 crossed over
The indicator:
1. When the background is green and the 2 lines are going up it means uptrend
2. When the background is red and the 2 lines are going down it means downtrend
3. When there is a crossover and the background outside BB turns yellow, it means there is a lot of volatility or volume
How to use (Or how I use this):
1. All trades based on the yellow color MUST be during a trend
2. When the color changes to yellow for the 1st time in the direction of a trend it is advisable to enter
Açık kaynak kodlu komut dosyası
Gerçek TradingView ruhuna uygun olarak, bu komut dosyasının oluşturucusu bunu açık kaynaklı hale getirmiştir, böylece yatırımcılar betiğin işlevselliğini inceleyip doğrulayabilir. Yazara saygı! Ücretsiz olarak kullanabilirsiniz, ancak kodu yeniden yayınlamanın Site Kurallarımıza tabi olduğunu unutmayın.
Feragatname
Bilgiler ve yayınlar, TradingView tarafından sağlanan veya onaylanan finansal, yatırım, işlem veya diğer türden tavsiye veya tavsiyeler anlamına gelmez ve teşkil etmez. Kullanım Şartları'nda daha fazlasını okuyun.