OPEN-SOURCE SCRIPT
Güncellendi PSAR Optimization Script

Hello!
User @henryph24 suggested I make this script!
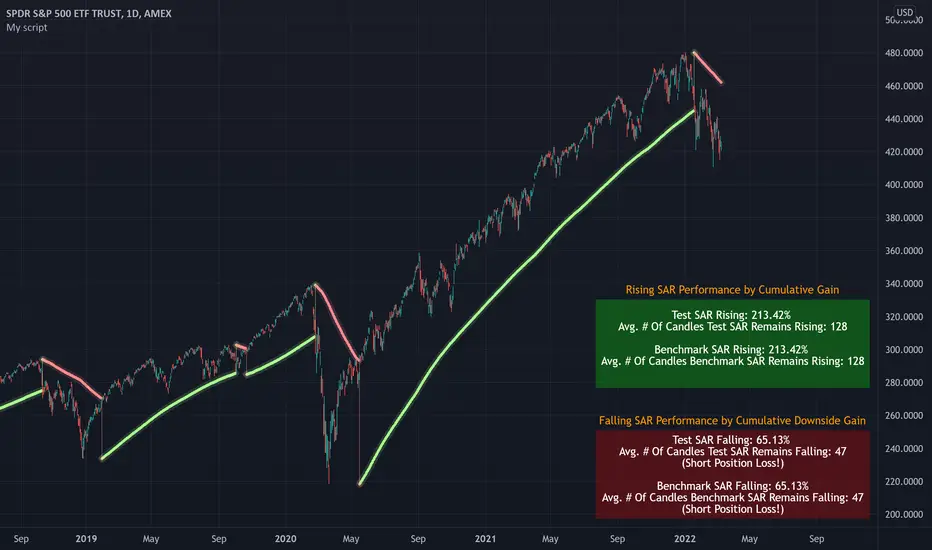
This script calculates the cumulative and average gain/Loss of rising SAR following a price crossover of SAR.
The cumulative and average gain/Loss of falling SAR following a price crossunder is also measured.
Changes to the parameters of SAR will return the requisite calculations for evaluating performance.
Benchmark SAR can be used to compare performance against test SAR.
When changing the SAR parameters the script will recalculate and display the rising SAR and falling SAR performance of the modified parameters. The script works for any asset on any timeframe.
Essentially, this script allows you to optimize SAR parameters, and quickly ascertain what can/cannot work for an asset.
The script automatically plots the best performing SAR between a benchmark SAR (SAR #1) and a test SAR (SAR #2). Both benchmark SAR and test SAR works the same. The two are used to compare performance between different SAR parameters. If you would like the script not to plot the best performing SAR you can select "On" for the "Override SAR" input box. Doing so will plot the SAR parameters of your choice while still allowing you to compare the performance of benchmark SAR and test SAR.
There are tooltips available in the user input tab that explain the SAR parameters, in addition to what your modifications of the parameters will do, should you be unfamiliar with the indicator!
Enjoy!
Sürüm Notları
Memory calculation compliantAçık kaynak kodlu komut dosyası
Gerçek TradingView ruhuyla, bu komut dosyasının mimarı, yatırımcıların işlevselliğini inceleyip doğrulayabilmesi için onu açık kaynaklı hale getirdi. Yazarı tebrik ederiz! Ücretsiz olarak kullanabilseniz de, kodu yeniden yayınlamanın Topluluk Kurallarımıza tabi olduğunu unutmayın.
•Access to Next-Gen Optimization Tools: tradingiq.io
•Discord Server: discord.gg/aKWPuM4HPy
•Discord Server: discord.gg/aKWPuM4HPy
Feragatname
Bilgiler ve yayınlar, TradingView tarafından sağlanan veya onaylanan finansal, yatırım, alım satım veya diğer türden tavsiye veya öneriler anlamına gelmez ve teşkil etmez. Kullanım Koşulları bölümünde daha fazlasını okuyun.
Açık kaynak kodlu komut dosyası
Gerçek TradingView ruhuyla, bu komut dosyasının mimarı, yatırımcıların işlevselliğini inceleyip doğrulayabilmesi için onu açık kaynaklı hale getirdi. Yazarı tebrik ederiz! Ücretsiz olarak kullanabilseniz de, kodu yeniden yayınlamanın Topluluk Kurallarımıza tabi olduğunu unutmayın.
•Access to Next-Gen Optimization Tools: tradingiq.io
•Discord Server: discord.gg/aKWPuM4HPy
•Discord Server: discord.gg/aKWPuM4HPy
Feragatname
Bilgiler ve yayınlar, TradingView tarafından sağlanan veya onaylanan finansal, yatırım, alım satım veya diğer türden tavsiye veya öneriler anlamına gelmez ve teşkil etmez. Kullanım Koşulları bölümünde daha fazlasını okuyun.