PROTECTED SOURCE SCRIPT
Güncellendi Six Sigma Enhanced
This script is a study of the Two Six Sigma patterns explored in the December 2018 issue of Technical Analysis of Stocks & Commodities (Stocks & Commodities V. 36:12 (8–12): Identifying High-Probability Buy Signals by François Picard, MS , & Edmond Miresco, PhD )
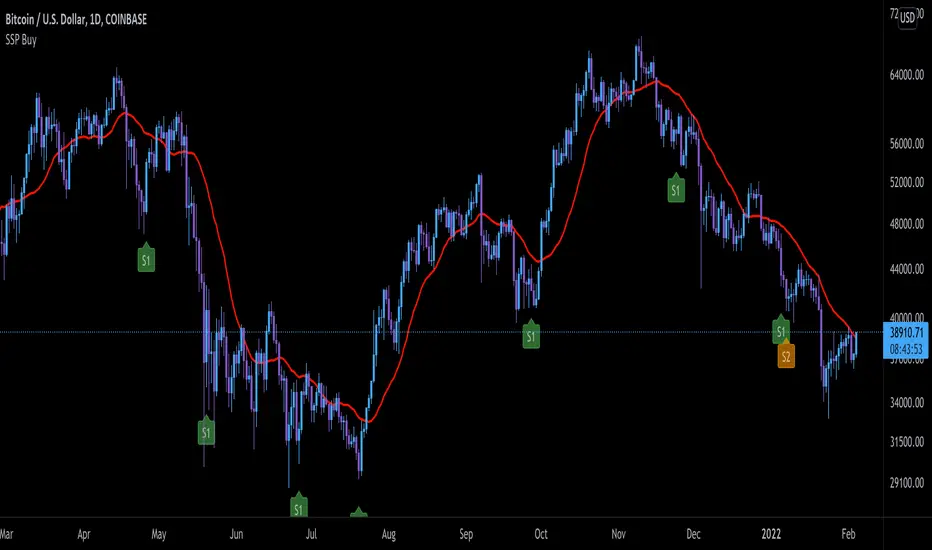
Signal 1 - 9 Closes Under MA
The first (Signal #1 or S1 on the chart) indicates 9 consecutive closes below the 20-period moving average. In the study, the authors used a simple moving average however I have modified it to use a MA to account for price distribution
Signal 2 - 6 Lower Closes and 9 Closes Under MA
The second signal (Signal #2 or S2 on the chart) indicates six consecutive periods where the close value is lower than the previous close and Signal 1.
Filter Signal Code provided by tradingview.com/u/AllTradeSignals/
Sürüm Notları
SMA is used to calculate plot lineSürüm Notları
migrated to v5Korumalı komut dosyası
Bu komut dosyası kapalı kaynak olarak yayınlanmaktadır. Ancak, ücretsiz ve herhangi bir sınırlama olmaksızın kullanabilirsiniz – daha fazla bilgiyi buradan edinebilirsiniz.
Feragatname
Bilgiler ve yayınlar, TradingView tarafından sağlanan veya onaylanan finansal, yatırım, alım satım veya diğer türden tavsiye veya öneriler anlamına gelmez ve teşkil etmez. Kullanım Koşulları bölümünde daha fazlasını okuyun.
Korumalı komut dosyası
Bu komut dosyası kapalı kaynak olarak yayınlanmaktadır. Ancak, ücretsiz ve herhangi bir sınırlama olmaksızın kullanabilirsiniz – daha fazla bilgiyi buradan edinebilirsiniz.
Feragatname
Bilgiler ve yayınlar, TradingView tarafından sağlanan veya onaylanan finansal, yatırım, alım satım veya diğer türden tavsiye veya öneriler anlamına gelmez ve teşkil etmez. Kullanım Koşulları bölümünde daha fazlasını okuyun.