PROTECTED SOURCE SCRIPT
1337PA
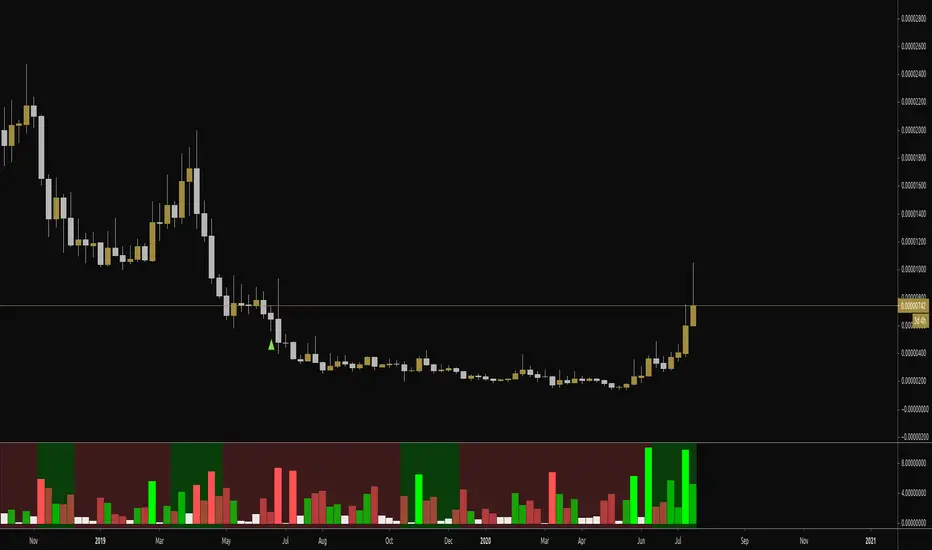
This script looks at % moves and uses z-scoring to highlight bars that are statistically significant in either direction.
The output columns values represent % moves within a trading period on an asset. The colors are explained below:
Lime - Significant
Bright red - Significant
Transparent lime - normal
Transparent red - normal
White - low %
It then uses a lookback function for a user-defined window and calculates the average % move on bullish bars and bearish bars.
When the average % move in the bullish direction over the lookback window becomes greater than the average % move in the bearish direction over the lookback window, it will highlight the background either green or red, signifying a trend in price.
It's a fantastic indicator to use in conjunction with

, which does similar things but for volume .
You can spot disparities in volume / price action and use that to inform trading decisions... for instance, a statistically significant volume day but a low significant PA day could provide some insight into the market.
You can also use the background (trend direction) in conjunction with the obv printout on 1337-Volume as multiple points of confirmation for trade decisions... i.e., volume and price action trend logic points to bearish or bullish outcome... or maybe price action is leaning bullish but volume suggests otherwise...
Enjoy!
The output columns values represent % moves within a trading period on an asset. The colors are explained below:
Lime - Significant
Bright red - Significant
Transparent lime - normal
Transparent red - normal
White - low %
It then uses a lookback function for a user-defined window and calculates the average % move on bullish bars and bearish bars.
When the average % move in the bullish direction over the lookback window becomes greater than the average % move in the bearish direction over the lookback window, it will highlight the background either green or red, signifying a trend in price.
It's a fantastic indicator to use in conjunction with
, which does similar things but for volume .
You can spot disparities in volume / price action and use that to inform trading decisions... for instance, a statistically significant volume day but a low significant PA day could provide some insight into the market.
You can also use the background (trend direction) in conjunction with the obv printout on 1337-Volume as multiple points of confirmation for trade decisions... i.e., volume and price action trend logic points to bearish or bullish outcome... or maybe price action is leaning bullish but volume suggests otherwise...
Enjoy!
Korumalı komut dosyası
Bu komut dosyası kapalı kaynak olarak yayınlanmaktadır. Ancak, ücretsiz ve herhangi bir sınırlama olmaksızın kullanabilirsiniz – daha fazla bilgiyi buradan edinebilirsiniz.
Feragatname
Bilgiler ve yayınlar, TradingView tarafından sağlanan veya onaylanan finansal, yatırım, alım satım veya diğer türden tavsiye veya öneriler anlamına gelmez ve teşkil etmez. Kullanım Koşulları bölümünde daha fazlasını okuyun.